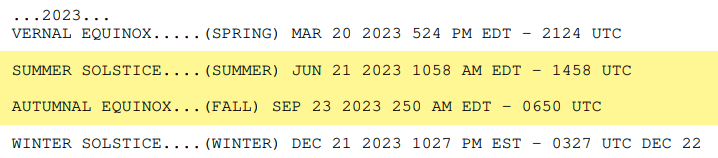
Summer 2023: June 21-September 23
Summer 2023: June 21-September 23
From the National Weather Service, Climate Prediction Center:
Summary of the Outlook for Non-Technical Users
“The June-July-August (JJA) 2023 temperature outlook favors above normal temperatures over the western contiguous United States (CONUS), the southwest, southeast, and along the eastern seaboard to New England. A tilt toward warmer than normal temperatures is also favored over most of Alaska. The largest probabilities of above normal temperatures (60 to 70 percent) are forecast over the Southwest, and probabilities reach 50 to 60 percent along the coast from Texas to New England. The JJA precipitation outlook favors below normal precipitation probabilities over the Pacific Northwest, Southwest, and south coast of Alaska. Above normal precipitation probabilities are more likely for the eastern CONUS, including the Southeast, Mid-Atlantic, Lower and Middle Mississippi Valley. The North Slope of Alaska also tilts weakly above normal. Equal chances (EC) are forecast for areas where probabilities for each category of seasonal mean temperatures and seasonal accumulated precipitation amounts are expected to be similar to climatological probabilities.”

Key Stats
Source: 2021 Service Annual Survey (SAS).

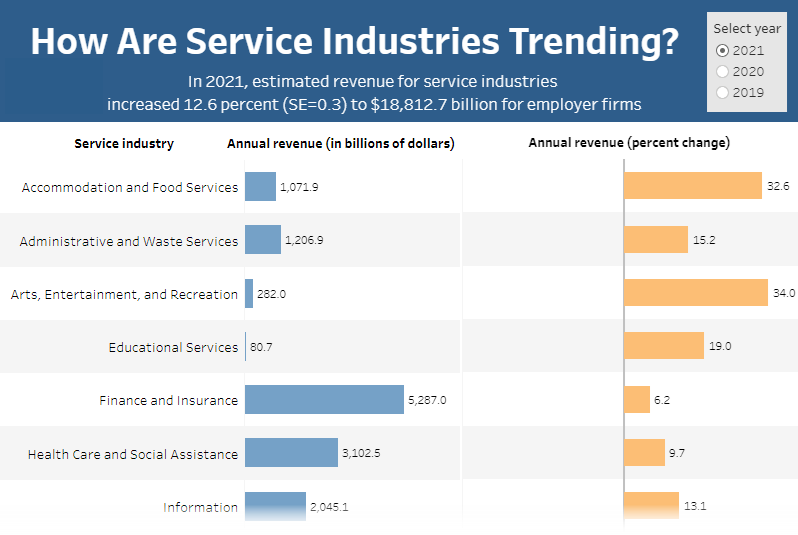
Note: The image above of the interactive visualization is cropped at the bottom. Click on the image for the full webpage.
More Stats
Source: Quarterly Services Survey (QSS).
Business & Industry > TIME SERIES / TREND CHARTS (Date ranges end: 2023).
Source: 2020 Annual Retail Trade Survey (ARTS).

Source: 2021 County Business Patterns (CBP).

- NAICS 532111, Passenger Car Rental
- NAICS 56151, Travel Agencies
- NAICS 71219, Nature Parks and Other Similar Institutions
- NAICS 71311, Amusement and Theme Parks
- NAICS 71391, Golf Courses and Country Clubs
- NAICS 71393, Marinas
- NAICS 721, Accommodation
- NAICS 72121, RV (Recreational Vehicle) Parks and Recreational Camps
- NAICS 721211, RV (Recreational Vehicle) Parks and Campgrounds
- NAICS 7225, Restaurants and Other Eating Places
Source: 2020 Annual Business Survey (ABS) Program.
Source: 2020 Annual Survey of State and Local Government Finances.
Table 1. State and Local Government Finances by Level of Government and by State: 2020, see Line 29, General Revenue, Air transportation (airports).
Note: The graphic “Government Revenue From Airports” was updated in October 2020 using 2018 data. The two Excel files above have the 2020 data, which are the latest data released from this survey.

Source: 2019 Service Annual Survey (SAS).
Source: 2019 Nonemployer Statistics (NES).
- NAICS 721, Accommodation
- NAICS 7225, Restaurants and Other Eating Places
Source: 2017 Economic Census.
- NAICS 532111, Passenger Car Rental
- NAICS 56151, Travel Agencies
- NAICS 71219, Nature Parks and Other Similar Institutions
- NAICS 71311, Amusement and Theme Parks
- NAICS 71391, Golf Courses and Country Clubs
- NAICS 71393, Marinas
- NAICS 721, Accommodation
- NAICS 72121, RV (Recreational Vehicle) Parks and Recreational Camps
- NAICS 721211, RV (Recreational Vehicle) Parks and Campgrounds
- NAICS 7225, Restaurants and Other Eating Places
From the Library / American Counts: Stories Behind the Numbers:
From the Newsroom:
Outside Links