Voting Turnout in Minnesota’s 3rd District and Colorado’s 2nd District Highest at 70%
Demographic characteristics of eligible voters in a congressional district can provide information and insight into voter turnout in elections.
Voter turnout in the 2018 congressional election was lower in districts with larger proportions of voting-age citizens without a high school diploma.
Voter turnout in the 2018 congressional election was lower in districts with larger proportions of voting-age citizens without a high school diploma.
Turnout is consistently lower for congressional elections than for national presidential campaigns, according to the Current Population Survey.
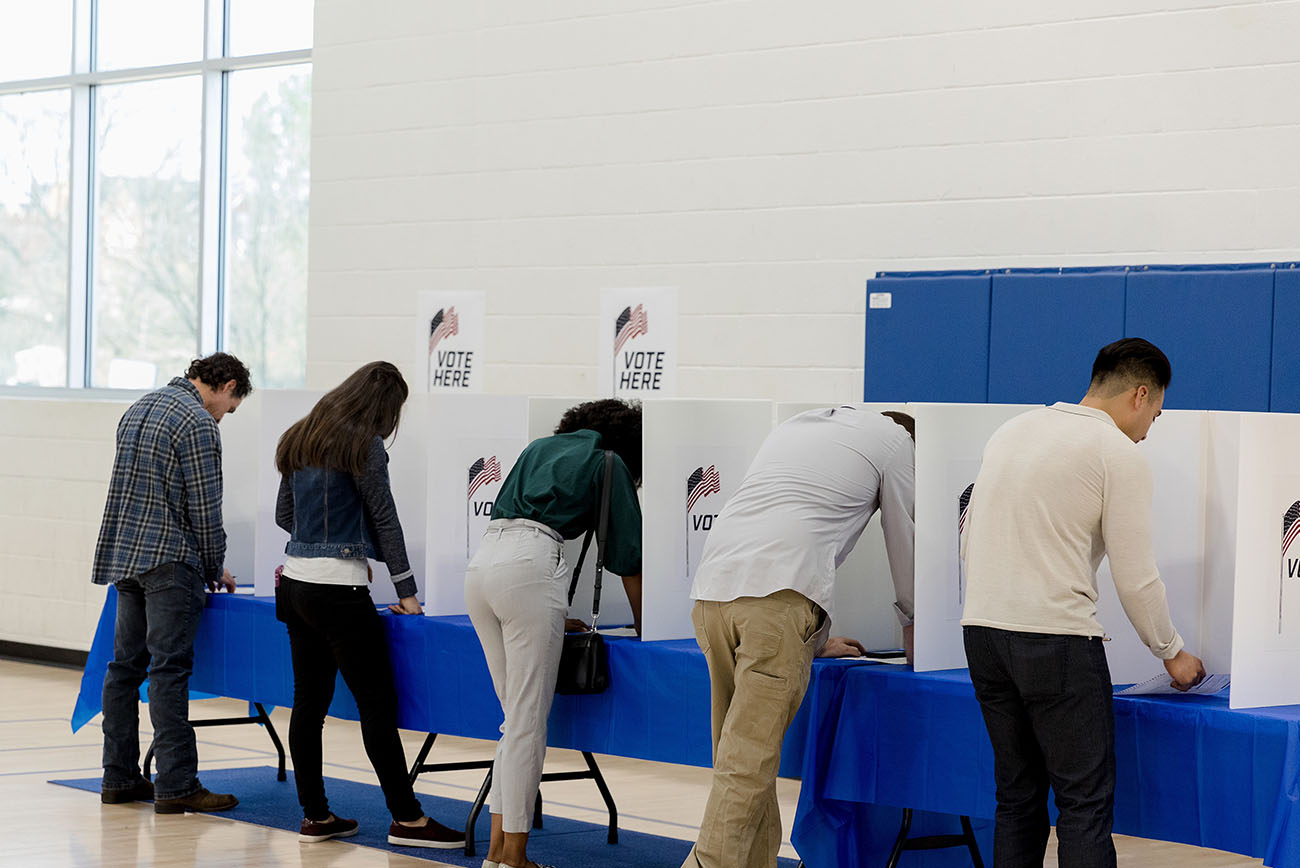
For example, in the 2018 congressional election about a quarter of registered voters reported they were too busy to vote. Yet, in any election demographic characteristics, such as education level, income and age, are all factors that may affect turnout at the polls.
The interactive graphic below uses Census Bureau population characteristics data from the American Community Survey and counts of votes cast from the Office of the Clerk U.S. House of Representatives.
The combined data highlight variations across the nation in both the percent of citizens who voted for congressional representatives in 2018 and the characteristics of the citizen voting-age population for each congressional district.
The interactive graphic shows:
- Two views of voting rates for congressional districts – a national-level perspective and a closer look at each state.
- Three views of the characteristics of the citizen voting-age population at the national level, at the state level and at the congressional district level.
Congressional District Voting Rates in the 2018 Election
Minnesota’s 3rd Congressional District and Colorado’s 2nd Congressional District led the country with the highest percentage (about 70%) of citizens voting for a representative in 2018. Arizona’s 7th District had the lowest rate (29.0%).
California had one of the widest ranges in voting rates across its 53 congressional districts, from 61.5% in the 18th District to 32.0% in the 21st District, a difference of nearly 30 percentage points.
Seven states, plus the District of Columbia, have only one congressional district each.

Note: Select the image to go to the interactive data visualization.
Demographic Characteristics of the Citizen Voting-age Population of Congressional Districts
Education
- New York’s 12th District has the highest percentage (71.0%) of voting-age citizens with a bachelor’s degree or more.
- In contrast, a quarter of eligible voters in New York’s 15th, California’s 40th and Texas’ 29th districts lack a high school diploma.
- In most instances, districts where a large proportion of voting-age citizens lacked a high school diploma had the lowest voter turnout in 2018.
Men and Women
Most districts, about 4 in 5, have more citizen voting-age women than men, according to the American Community Survey.
New York’s 8th District has the highest percentage (56.5%) of citizen voting-age women in the country. In contrast, California’s 21st and 51st districts and Alaska’s at-large district have among the lowest percentages (about 47%) of women. In general, women are more likely than men to register and vote.
Race and Hispanic Origin
- In Hawaii’s 1st District, about half of the voting-age citizens are Asian, the highest percentage in the country.
- Hawaii’s 2nd District has 12.1% Native Hawaiian and other Pacific Islanders – the highest percentage in the country.
- Hispanics made up more than half of voting-age citizens in 24 congressional districts: Arizona (3rd), California (21st, 29th, 32nd, 35th, 38th, 40th, 41st, 44th, 46th and 51st), Florida (25th, 26th and 27th), Illinois (4th), New York (15th) and Texas (15th, 16th, 20th, 23rd, 28th, 29th, 34th, and 35th).
Across these heavily Hispanic districts, voting rates in 2018 ranged from 54.4% to 31.3%.
About the Data
This Census Bureau infographic shows all congressional districts for 2018. It combines the counts of votes cast for each congressional race, as collected by state election offices and reported nationally by the Office of the Clerk U.S. House of Representatives, with estimates of the citizen voting-age population from the 2018 American Community Survey.
Voting rates are calculated by using the number of administratively counted ballots divided by the survey estimate of the citizen voting-age population.
Four congressional districts in Florida (10th, 14th, 21st and 24th) and one in North Carolina (9th) do not have computed voting rates because the states did not report vote totals for these districts. Florida state law prohibits candidates without an opponent from having their name printed on the ballot, and North Carolina’s Board of Elections ordered a new election for the 9th District in February 2019.
Jennifer Cheeseman Day is a demographer in the Census Bureau’s Communication Directorate.
Thom File is a senior sociologist in the Social, Economic and Housing Statistics Division.
Stats for Stories
Subscribe
Our email newsletter is sent out on the day we publish a story. Get an alert directly in your inbox to read, share and blog about our newest stories.
Contact our Public Information Office for media inquiries or interviews.
-
America Counts StoryBehind the 2018 U.S. Midterm Election TurnoutApril 23, 2019New Census Bureau data show that voting increased among all voting age and major racial and ethnic groups.
-
America Counts StoryVoter Turnout for Non-Hispanic Black Population DeclinesAugust 09, 2017For only the second time since 1980, the share of non-Hispanic white voters did not drop since the last presidential election.
-
America Counts StoryExplore My Congressional District Data ToolMarch 27, 2019Interest in the My Congressional District tool peaked after the midterm elections and is expected to continue now that the new Congress is sworn in.
-
PopulationMeasuring Foreign-Born Population Over Nation’s 250-Year HistoryJuly 21, 2026Historical census data document changes in the foreign-born population in both numbers and countries of origin.
-
Business and EconomyA Road Trip Across the Vacation EconomyJuly 14, 2026The Census Bureau rings in the summer with a travel statistics road map.
-
HealthWhere You Live Matters for Your Health and So Does How We Measure ItJuly 09, 2026Census Bureau research helps policymakers and researchers identify the most reliable ways to predict health outcomes and distribute resources accordingly.
-
PopulationU.S. Fertility Continues to Drop but Still High in Some CountiesJune 25, 2026Counties with the highest numbers of births have some of the lowest fertility rates.