
Combining Census Bureau Pulse Surveys Reveals Which Workers Are Hardest Hit by COVID-19
Self-employed workers in states where businesses are hardest hit by the COVID-19 pandemic are more likely to face economic hardships, according to new findings from the U.S. Census Bureau’s experimental Household and Small Business Pulse surveys.
Creating jobs and running small businesses are just a couple of examples of the vital roles self-employed workers play in the U.S. economy.
In states where business conditions were hardest-hit by COVID-19... 13.9% of self-employed workers received free groceries or a free meal during the last seven days from sources such as food banks, religious organizations, community programs, or family, friends or neighbors.
Economic uncertainty related to COVID-19 has presented unique challenges for self-employed workers, from temporary closures to revenue losses.
We combined results from two new surveys to shed light on these challenges, using the Small Business Pulse Survey to identify states with businesses most affected by the COVID-19 pandemic and demographic data from the Household Pulse Survey.
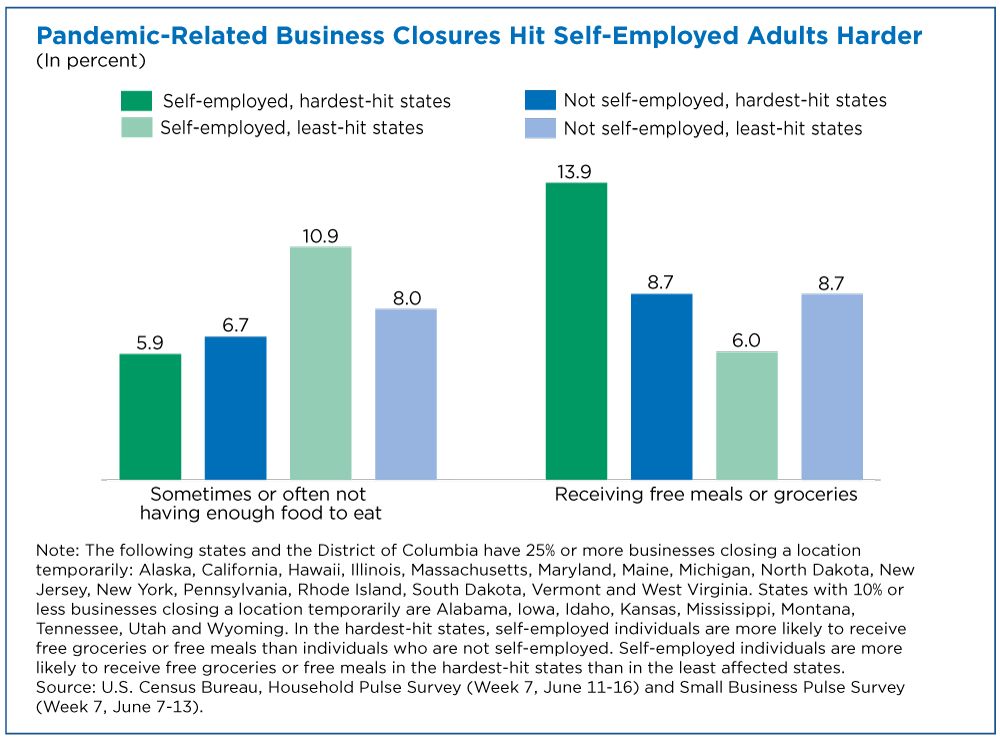
Self-Employed Hit Harder Where More Businesses Closed Temporarily
In states where business conditions were hardest-hit by COVID-19 (states with 25% or more of businesses temporarily closed for one day or more), 13.9% of self-employed workers received free groceries or a free meal during the last seven days from sources such as food banks, religious organizations, community programs, or family, friends or neighbors.
In contrast, 8.7% of non-self-employed workers in these states received free meals.
In the least-affected states (those where 10% or less businesses temporarily closed for one day or more), there was no statistical difference by self-employment status in the rate of those receiving free groceries or a free meal.
Self-employed workers in the hardest-hit states reported either “sometimes not having enough to eat” or “often not having enough to eat” 5.9% of the time in the past week, which is not statistically different from the rate reported by other workers in these states.
Similarly, there was no statistical difference in food insufficiency by self-employment status in states least affected by the pandemic.
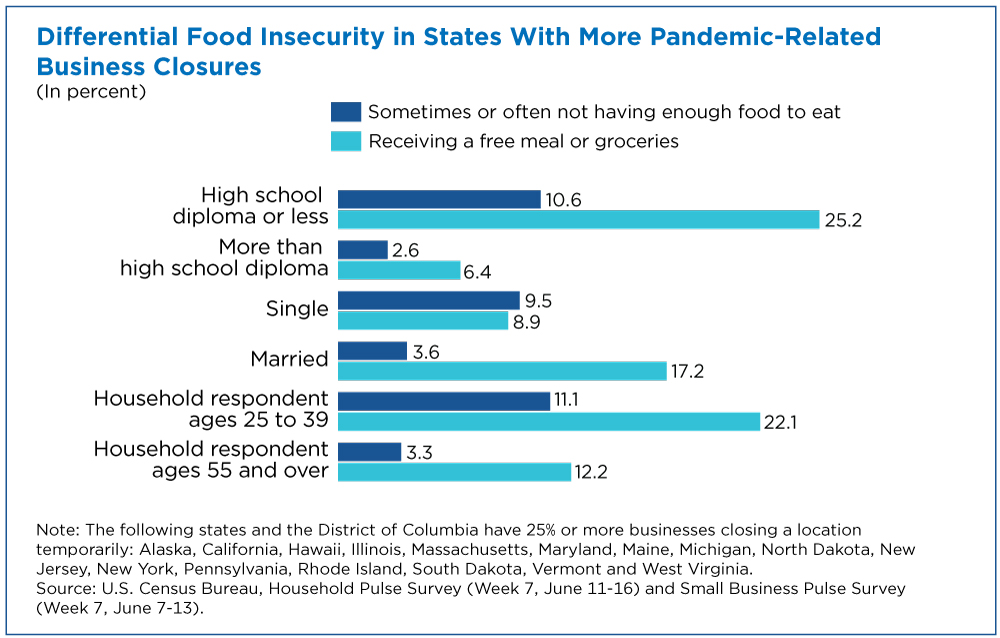
Higher Education, Lower Food Shortages
Among the self-employed in the hardest-hit states, 10.6% of adults with a high school degree or less reported either “sometimes not having enough to eat” or “often not having enough to eat” in the past week, while 2.6% of adults with more than a high school degree reported that same level of food shortages.
In these states, 25.2% of self-employed adults with a high school degree or less received free groceries or a free meal in the past week, compared with 6.4% of self-employed adults with more than a high school degree.
Single Adults More Likely to Lack Food
Among self-employed workers in the hardest-hit states, 9.5% of single adults reported either “sometimes not having enough to eat” or “often not having enough to eat” in the past week, while 3.6% of married adults reported that same level of food insufficiency.
Although they were more likely than married self-employed individuals to report insufficient food, single self-employed individuals were less likely to receive free groceries or a free meal.
Among self-employed workers in the hardest-hit states, 8.9% of single adults received free groceries or a free meal in the past week, compared with 17.2% of married adults.
Food Shortages More Common Among Younger Adults
Among self-employed workers in the hardest-hit states, younger adults ages 25 to 39 were more likely to report either “sometimes not having enough to eat” or “often not having enough to eat” in the past week (11.1%) than adults ages 55 and above (3.3%).
Among self-employed workers in these states, 22.1% of adults ages 25 to 39 received free groceries or a free meal in the past week, which was not statistically different from the frequency reported by adults ages 55 and above.
What Is the Household Pulse Survey?
The Census Bureau, along with other government agency partners, designed the Household Pulse Survey to collect and disseminate data in near real-time to provide vital insights into how American households are faring during the COVID-19 pandemic.
Individual-level data on self-employment status, state of residence, receipt of free groceries or a free meal, food insufficiency, marital status, education, and age come from the Household Pulse Survey.
We collected the first round of data April 23-May 5 — and the most recent round June 11-16. During this most recent round, the Census Bureau sent invitations to 1,172,900 households across America by email and SMS text message, and 73,472 households responded. This sample size allows for representative state-level estimates.
For a closer look at Census Household Pulse Survey data, see the Household Pulse Survey tables, technical documentation and Public Use File (PUF) microdata.
What Is the Small Business Pulse Survey?
The Census Bureau designed the Small Business Pulse Survey to collect and disseminate data in near real-time to provide vital insights into changes in conditions for our nation’s small businesses during the COVID-19 pandemic.
It also provides detailed information about small business-specific initiatives, such as the Paycheck Protection Program. The percentage of businesses in each state that temporarily closed a location, our measure of business conditions, comes from the Small Business Pulse Survey.
The Small Business Pulse Survey targets small businesses (those with between one and 499 employees), and does not include non-employer businesses.
We collected the first round of data for the April 26-May 2 period. We utilize data collected June 7-13. During this more recent round, the Census Bureau sent invitations to 92,777 employer businesses across America, and 23,896 businesses responded. This sample size allows for representative state-level estimates. The sample for the Small Business Pulse Survey is unrelated to the sample for the Household Pulse Survey.
For a closer look at Census Small Business Pulse Survey data, see the Small Business Pulse Survey results.
Mark Klee and Lynda Laughlin are survey statisticians and Robert Munk is an economist in the Census Bureau’s Social, Economic and Housing Statistics Division.
Subscribe
Our email newsletter is sent out on the day we publish a story. Get an alert directly in your inbox to read, share and blog about our newest stories.
Contact our Public Information Office for media inquiries or interviews.
-
America Counts StoryHow Are Americans Using Their Stimulus Payments?June 24, 2020The majority of adults who received a stimulus payment are spending it on household expenses (70.1%), and 15.7% to pay off debt; only 14.1% plan to save it.
-
America Counts StoryLow-Income and Younger Adults Hit Hard by Income Loss During PandemicJune 19, 2020The Census Bureau’s new Household Pulse Survey provides vital insight into how adults are faring during the COVID-19 pandemic and who is hardest hit.
-
America Counts StoryNew Census COVID-19 Hub Helps Guide Pandemic RecoveryJune 08, 2020New tool features 27 demographic, socio-economic and housing variables and data on the number of businesses, employment and payroll.
-
Families and Living ArrangementsOver a Third of Partners in Opposite-Sex Couples Were the Same AgeApril 27, 2026A new interactive data visualization explores characteristics of opposite-sex married and unmarried couples who lived together in 2025.
-
PopulationEight of the Nation’s Top 15 Last Names Stayed the Same Since 1790April 14, 2026Newly released names data from the 2020 Census show which first and last names are the most popular across the nation.
-
AgeU.S. Population Aging as Nation Turns 250April 09, 2026New population estimates show women still outnumbered men at older ages, but the gap is narrowing due to lower mortality rates and historical factors.
-
Business and EconomyState Lottery Ticket Sales Soar as Prizes Get LargerApril 08, 2026While sales nearly doubled to $104.7 billion from 2008 to 2024, state lottery prizes more than doubled to $34.5 billion in FY 2024.