
Census Bureau’s 2018 County Business Patterns Provides Data on Over 1,200 Industries
Which industry had the highest employment and annual payroll in 2018?
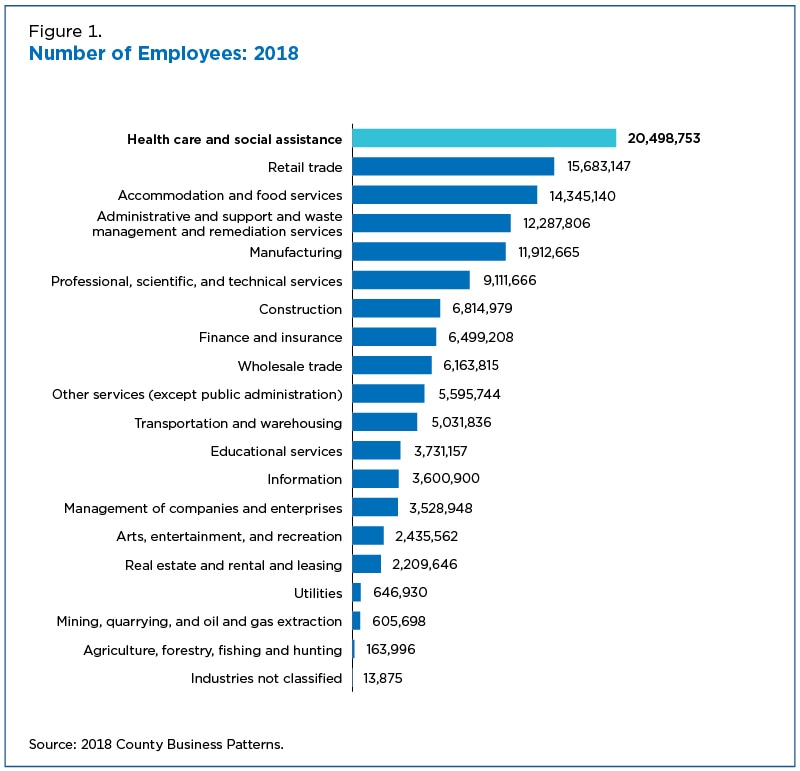
According to the U.S. Census Bureau’s County Business Patterns (CBP), the 907,426 businesses in the Health Care and Social Assistance sector topped all others with 20 million employees and over $1.0 trillion in annual payroll in 2018.
And the U.S. Bureau of Labor Statistics (BLS) projects this sector will grow 14% from 2018 to 2028, due largely to an aging population with increased health care needs.
The data are used to forecast market potential, economic activity, employment workforce, and industry trends.
The 2018 CBP provides the latest in an annual series of statistics instrumental in the monitoring of economic activity. Nationally, there were 7,912,405 businesses in all sectors in 2018, up 51,731 (or 0.7%) from 2017.
Total employment increased 2.3 million to 130.9 million between 2017 and 2018. Annual payroll increased $372.0 billion over this period, to $7.1 trillion in 2018.
Paid employment consists of full- and part-time employees, including salaried officers and executives of corporations on the payroll during the week of March 12. Also included are employees on paid sick leave, holidays, and vacations. Not included are sole proprietors and partners of unincorporated businesses.
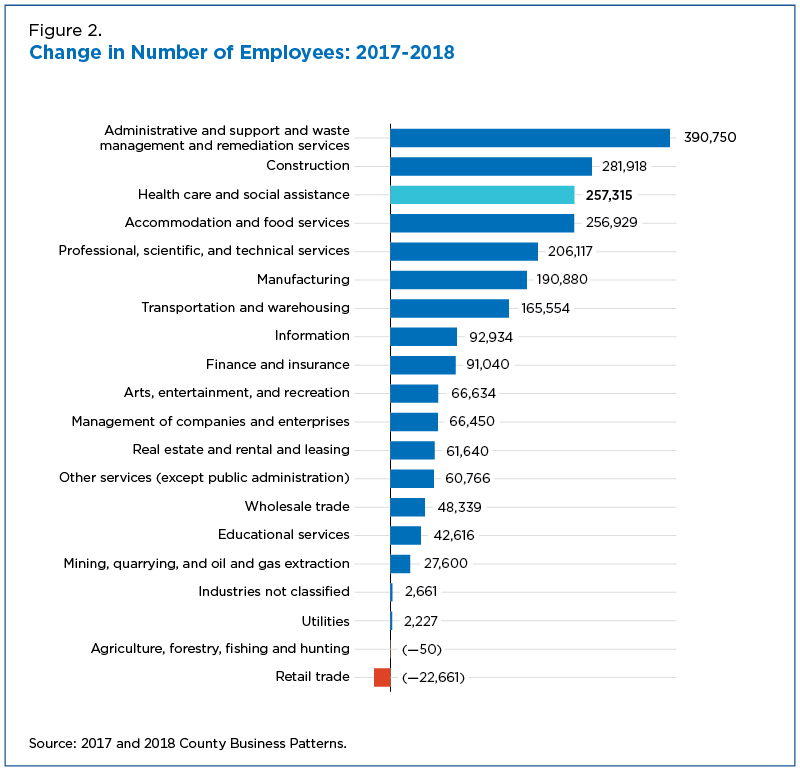
The Administrative and Support and Waste Management and Remediation Services sector saw the highest increase in employment between 2017 and 2018, up 390,750 to 12.3 million.
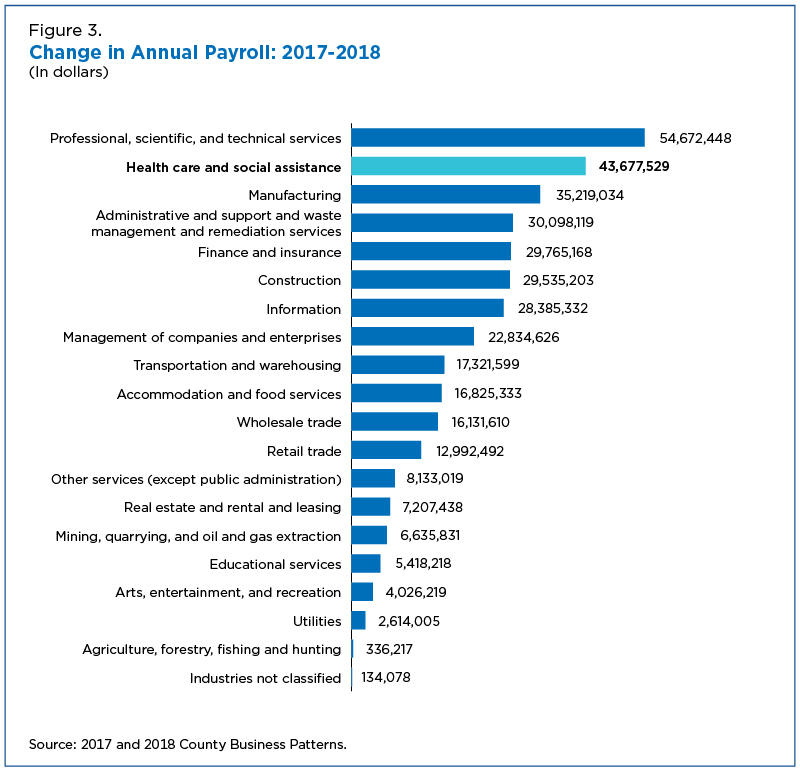
However, the largest increase in annual payroll came from the Professional, Scientific, and Technical Services sector: up $54.7 billion to $801.7 billion in 2018.
Health Care Sector
Among fast-growing industries in the Health Care and Social Assistance sector:
- General Medical and Surgical Hospitals, which gained the most annual payroll, up $13.8 billion between 2017 and 2018 to $364.2 billion.
- Home Health Care Services, which added the most employees between 2017 and 2018, up 72,255 to 1.5 million.
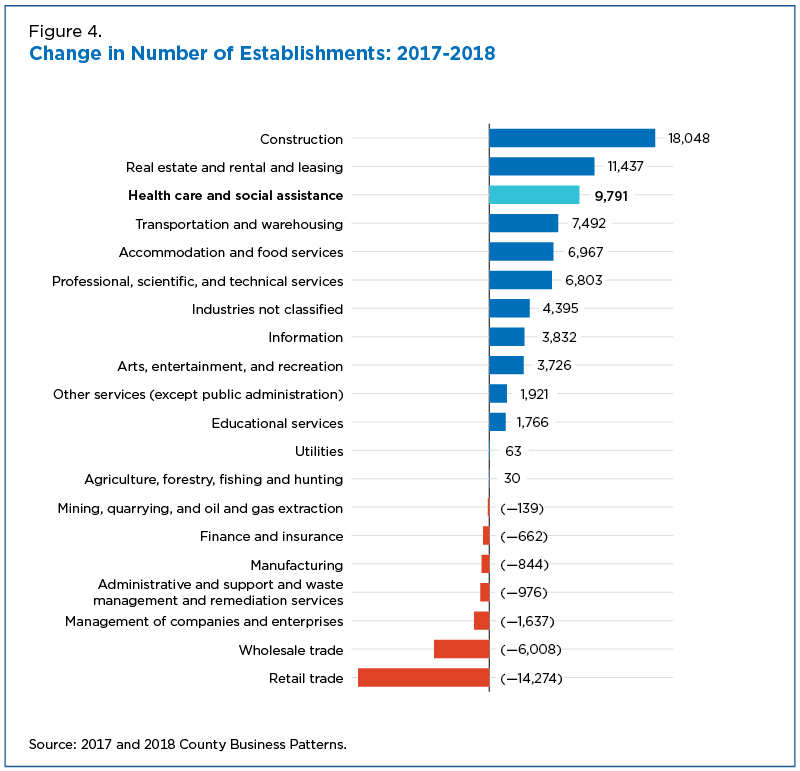
- Individual and Family Services, which added the most establishments between 2017 and 2018, up 4,915 to 80,577..
Wealth of Data on Employers and Nonemployers
CBP offers detailed information on the number of establishments, total employment, first quarter payroll, and annual payroll in more than 1,200 industries at the national, state, metropolitan and micropolitan statistical area, county, congressional district, and combined statistical area (CSA) levels.
The data are used to forecast market potential, economic activity, employment workforce, and industry trends. In addition, state and local governments use the data to evaluate business changes and develop future policies and programs.
While CBP covers businesses with one or more paid employees, Nonemployer Statistics (NES) provides subnational economic data for businesses with no paid employees that have annual business receipts of at least $1,000 and are subject to federal income tax.
The raw NES data come from the Internal Revenue Service and cover approximately 450 industries at national, state, county and metropolitan statistical area levels.
The 2018 County Business Patterns and Nonemployer Statistics Combined Report merges employer and nonemployer data by industry providing a more complete picture of the overall U.S. economy.
Many users only think of businesses in the Health Care sector with employees. But there are also over two million nonemployer health care businesses, such as home health care providers and other ambulatory health care services, which reported over $71.6 billion in revenue in 2018.
The Health Care and Social Assistance sector is often at the forefront of innovation. Health systems are rapidly re-inventing themselves with digital health technologies such as patient monitoring applications, surveillance tools to map emerging public health threats, and voice-enabled health care tools for Amazon’s Alexa.
In an article in Health Affairs, the Bureau of Labor Statistics credited health care jobs for helping the economy recover from the 2007-2008 financial crisis. From 2006 to 2016, the health care sector grew seven times faster than any other area of the economy.
Earlene K.P. Dowell is program analyst in the Census Bureau’s Data Users Trade and Outreach Branch.
-
Stats for StoriesNational Manufacturing Day: October 3, 2025The U.S. Census Bureau joins organizations across the country celebrating the importance of the manufacturing sector of the nation’s economy.
-
Stats for StoriesCertified Nurses Day: March 19, 2024The 2022 American Community Survey estimates there were 2,607,050 registered nurses employed full-time, year-round in the U.S. (2,247,784 female, 359,266 male).
Subscribe
Our email newsletter is sent out on the day we publish a story. Get an alert directly in your inbox to read, share and blog about our newest stories.
Contact our Public Information Office for media inquiries or interviews.
-
America Counts StoryManufacturing Still Among Top Five U.S. EmployersOctober 02, 2020Held annually on the first Friday in October, Manufacturing Day showcases the contributions of a key economic sector.
-
America Counts StoryA Profile of the Retail WorkforceSeptember 08, 2020The nation’s 9.8 million retail workers accounted for 6.3% of the U.S. labor force.
-
America Counts StoryA Look at Businesses in Coastline Counties During Hurricane SeasonJuly 15, 2020Population growth in areas most vulnerable to hurricanes is of concern to emergency managers but so are the 2.4 million businesses in coastline areas.
-
PopulationMeasuring Foreign-Born Population Over Nation’s 250-Year HistoryJuly 21, 2026Historical census data document changes in the foreign-born population in both numbers and countries of origin.
-
Business and EconomyA Road Trip Across the Vacation EconomyJuly 14, 2026The Census Bureau rings in the summer with a travel statistics road map.
-
HealthWhere You Live Matters for Your Health and So Does How We Measure ItJuly 09, 2026Census Bureau research helps policymakers and researchers identify the most reliable ways to predict health outcomes and distribute resources accordingly.
-
PopulationU.S. Fertility Continues to Drop but Still High in Some CountiesJune 25, 2026Counties with the highest numbers of births have some of the lowest fertility rates.