
In 2017, Small States Led Nation in Several Industry Sectors, California Led in 11 of 18
California has the highest population of any state and it comes as no surprise that in 2017, led the nation in sales, shipments or revenues in 11 of the 18 North American Industry Classification System (NAICS) sectors covered by the 2017 Economic Census.
But smaller states from North Dakota and Wyoming to Indiana and Wisconsin were at the top of their rankings in different categories and sectors.
States with large populations were not the only ones to lead the nation. North Dakota experienced the biggest jump ($4.1 billion) in revenue over this period for the mining sector. South Carolina led in manufacturing (up $39.4 billion).
The 2017 Economic Census Geographic Area Statistics are the most detailed geographic business data available from the Census Bureau. Data are not only shown at the broad 2-digit NAICS sector levels in this story but are published down to the more detailed 6-digit (and selected 7- and 8-digit) NAICS levels for the nation and states.
The series also includes data at the metro area, county and economic place (city or town) levels for selected NAICS sectors, which are crucial resources for a wide variety of business data users.
For example, the data from 2017 shows Texas led the nation in revenue in four sectors: Mining, Quarrying, and Oil and Gas Extraction ($137.8 billion); Wholesale Trade ($1.2 trillion); Manufacturing ($575.2 billion); and Transportation and Warehousing ($101.9 billion).
Wholesale trade was the largest sector in the United States in terms of revenue ($8.7 trillion) in 2017.
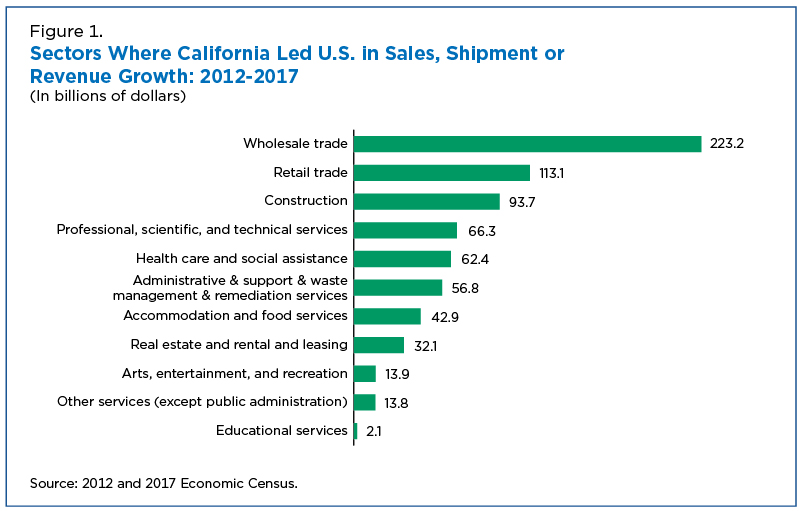
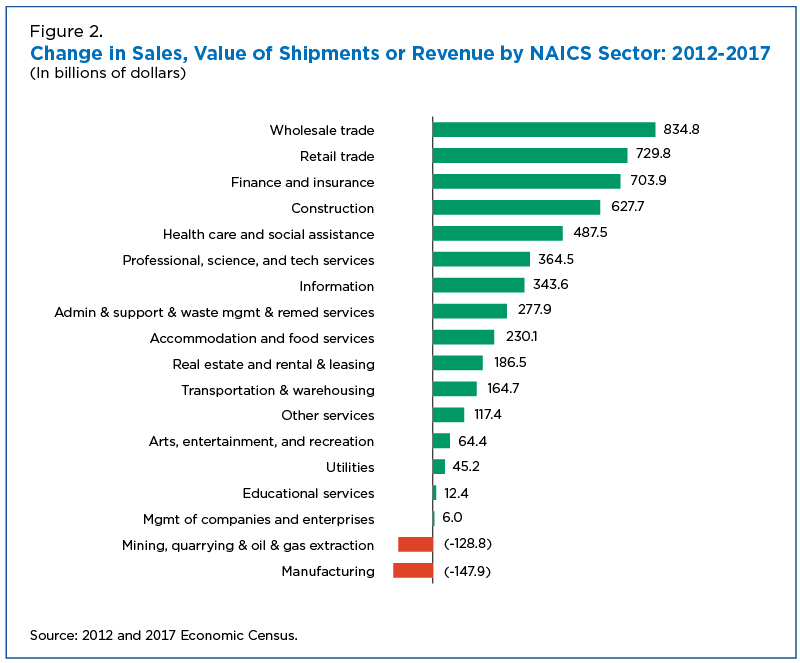
Businesses in California had the largest increase in revenue between 2012 and 2017 in 11 sectors (Figure 1), with wholesale trade gaining the most. The growth in wholesale trade in California mirrors the national increase in sales in this sector from 2012 to 2017, up $834.8 billion. (Figure 2)
States with large populations were not the only ones to lead the nation. North Dakota experienced the biggest jump ($4.1 billion) in revenue over this period for the mining sector. South Carolina led in manufacturing (up $39.4 billion).
Where the Jobs Were in 2017
Once again, California dominated.
In 2017, California businesses employed the most workers of any state in 16 of the 18 NAICS sectors, with a total of 13.1 million workers in these 16 sectors. The state led the nation in employment growth between 2012 and 2017 in 10 sectors; these businesses added 1.4 million workers over this period.
The Health Care and Social Assistance sector was the largest employer in California, with over 2 million workers, and was also the nation’s largest employer in 2017, with 20.5 million employees.
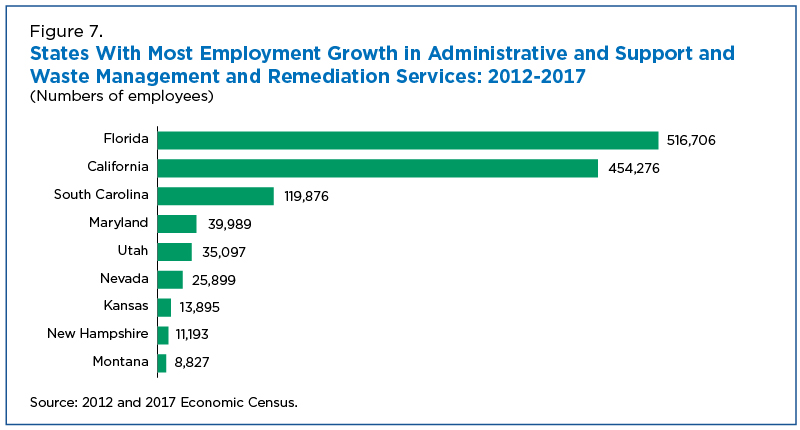
Texas had the most employees in the Mining sector (208,828) and Florida in the Administrative and Support and Waste Management and Remediation Services sector (1.7 million).
Nationally, the highest increase in employment between 2012 and 2017 was in the administrative and support sector: up 2.1 million to 11,889,169.
This sector includes a diverse mix of businesses, including temporary help services, landscapers, janitorial services, security services, and travel agencies. Florida ranked first in employment growth in that sector, gaining 516,706 workers, and California ranked second with an increase of 454,276 workers.
Texas had the largest growth in employment in five sectors (Figure 3) while Michigan and Wisconsin led in the manufacturing (up 68,307 workers) and mining (up 1,715 workers) sectors, respectively.

Places That Paid the Most
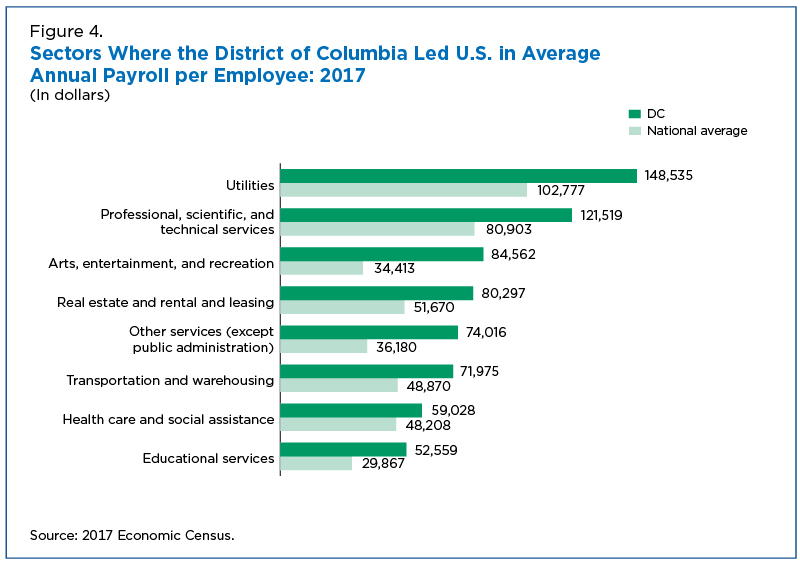
The District of Columbia is a good place to be if employed by businesses in several key sectors, from utilities and transportation to professional and educational services and arts and entertainment (Figure 4). Washington, D.C., had the highest average annual payroll per employee in 2017 in eight NAICS sectors.
Alaska is a good place for workers in the mining and Construction sectors. In 2017, businesses in the state reported the highest average annual payroll per employee in these two sectors ($106,347 and $76,190, respectively).
In 2017, those working in two sectors — finance and insurance and administrative and support — earned the most in New York. The state was the nation’s top payer ($194,317 and $53,035, respectively).
If you worked in the Retail Trade or Information sectors, the opposite coast was more lucrative: Businesses in the state of Washington had the highest average annual payroll in 2017 ($32,821 and $161,569, respectively).
Nationally, the Information sector reported the highest increase in average annual payroll per employee between 2012 and 2017, up $20,127 to $101,143 in 2017.
This sector not only includes businesses classified as News Syndicates and Publishers, but also as Motion Picture and Sound Recording, Broadcasting, and Telecommunications.
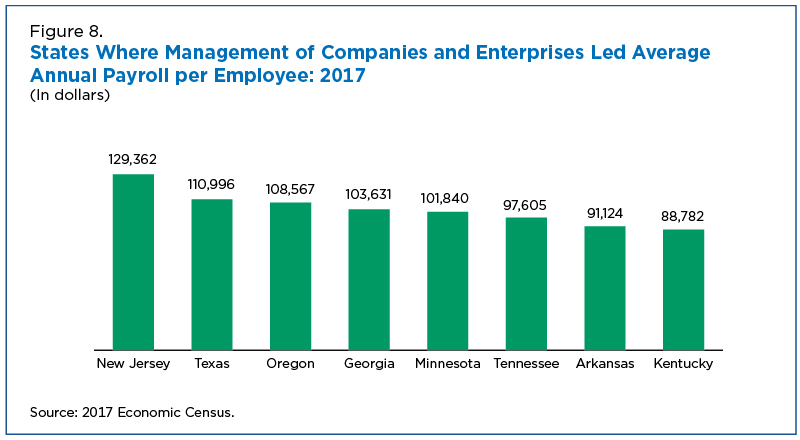
California had the nation’s highest average annual payroll per employee in the Management of Companies and Enterprises sector ($134,132); businesses in this sector reported the highest average annual payroll per employee in the nation in 2017 ($102,957).
Other leaders in average annual payroll per employee in 2017 Connecticut in manufacturing ($70,281); Delaware in wholesale (104,444); and Nevada in Accommodation and Food Services sector ($29,971).
Nation’s Top Sectors in Sales, Shipments, or Revenue in 2017
Just as Wholesale Trade is the largest sector in total sales in the United States, it was also king in 32 states in 2017. Wholesale Trade also saw the largest increase in sales from 2012 to 2017 in 22 states.
Retail Trade was the top sales growth sector in 12 states. Florida retail sales were up $59.3 billion between 2012 and 2017.
Where certain industry sectors rank high:
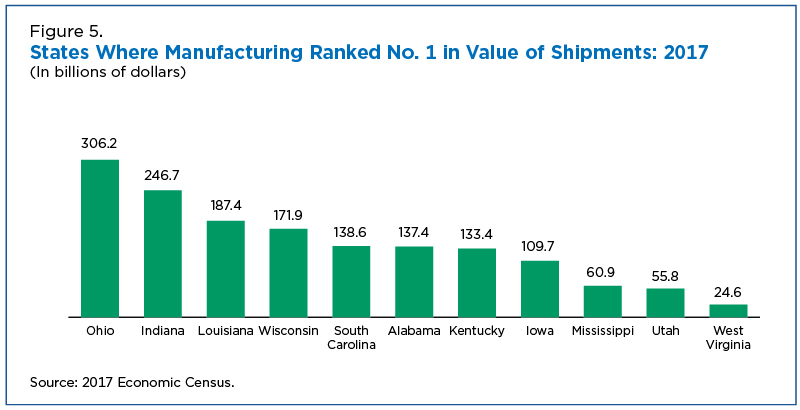
- Manufacturing was the top sector in shipment in 11 states (Figure 5). It grew the most in Alabama, South Carolina and Tennessee. (South Carolina gained the most, up $39.4 billion.)
- Retail was tops in five states (Hawaii, Maine, Nevada, New Hampshire and New Mexico). In Nevada, total retail sales in 2017 were $45.1 billion, the largest of these five states.
- Mining ranked highest in Alaska, ($12.3 billion) and Wyoming ($12.8 billion).
- Professional, Scientific, and Technical Services was the top sector in revenue in Washington, D.C. ($37.2 billion).
- Health Care grew the most in eight states led by Louisiana, where it increased by $6.7 billion.
- Construction saw the largest increase in revenue between 2012 and 2017 in Colorado ($24.4 billion), Kansas ($4.7 billion), and Nevada ($8.3 billion)
- Professional Services went up in D.C. ($5.4 billion) and New Mexico ($2.5 billion).
- Mining saw the largest increase in North Dakota ($4.1 billion).
Who Is Hiring and Where in 2017?
While wholesale trade may be king in terms of sales, health care rules in terms of employment. This sector employed the most people in 41 states in 2017, with over 2 million working in this sector in California alone (Figure 6).

Top employment sectors by state:
- Professional Services employed the most workers (108,016) in Washington, D.C., and Virginia (470,265) in 2017,
- Administration and Support was tops in Florida (1.7 million workers) and South Carolina (276,277).
- Accommodation and Food Services was the largest employer in two tourism-dominated states: Hawaii, (112,743 workers) and Nevada (319,584).
- Retail was largest employer in New Hampshire (96,591 workers) and Utah (153,633).
- Manufacturing was the largest employer in Indiana (496,083) and Wisconsin (455,538).
Sectors that gained the most employees:
- Health Care employment grew the most in 22 states, with Texas gaining the most (253,913) employees.
- Administration and Support gained the most employees in nine states. Florida added the most (516,706) workers (Figure 7).
- Accommodation and Food Services sector saw the greatest employment growth between 2012 and 2017 in 10 states. Georgia added 73,246 workers, the biggest gain in this sector during this period.
- Manufacturing was the largest employer in Indiana and Wisconsin in 2017, and this sector gained the most employees in Indiana and Michigan (43,570 and 68,307 employees, respectively)..
- Professional Services gained the most employees in Massachusetts (55,291), Minnesota (45,670), and New Mexico (12,520).
- Finance gained the most (7,682) in Delaware.
- Other Services gained the most employees (14,774) in the District of Columbia.
Average Annual Payroll per Employee in 2017
The Utilities sector was one of the smallest employer sectors in the United States (with only 658,384 workers nationwide), yet businesses in this sector reported the highest average annual payroll per employee of any sector in 2017 in 33 states.
Management was tops in eight states (Figure 8). Finance and Insurance was the highest payer in Connecticut, the District of Columbia, Massachusetts and New York; New York led the pack, paying an average annual payroll per employee in this sector of $194,713.
Mining reported the highest average annual payroll per employee in Alaska, New Mexico, and North Dakota (Alaska was tops at $106,347). Information was tops in California ($158,169), and Washington ($161,569) and Wholesale was the leader in Delaware ($104,444).
None of these data would be possible without the millions of U.S. businesses that respond to the Economic Census and other Census Bureau business surveys.
Andrew Hait is an economist at the U.S. Census Bureau.
Notes: As is required by Title 13 of the U.S. Code, the Census Bureau withholds data to protect the privacy of individual companies. These suppressions can affect the state and sector rankings shown in this story. Also, dollar figures in this story are not adjusted for inflation or price change, which could affect comparisons over time.

Redistricting & Voting Rights Data Office (RDO)
Visualizations

2020 Census Demographic Data Map Viewer is a web map application that includes state-, county-, and census tract-level data from the 2020 Census.
Data
Fact Sheets
Blog Posts
Newsroom
Census Academy
View training resources for 2020 Census data.
Videos
Maps
-
2020 Census Demographic Data Map ViewerThe 2020 Census Demographic Data Map Viewer is web map application that includes state, county, and tract-level data from the 2020 Census.
-
2020 Census P.L. 94-171 Redistricting Data Map SuiteHere you will find the 2020 Census P.L. 94-171 Redistricting Data Map Suite
-
TIGER/Line ShapefilesView all the available mapping files from the Geography program.
Story Ideas and Statistics
Subscribe
Our email newsletter is sent out on the day we publish a story. Get an alert directly in your inbox to read, share and blog about our newest stories.
Contact our Public Information Office for media inquiries or interviews.
-
America Counts StoryA Profile of the Retail WorkforceSeptember 08, 2020The nation’s 9.8 million retail workers accounted for 6.3% of the U.S. labor force.
-
America Counts StoryA Look at Businesses in Coastline Counties During Hurricane SeasonJuly 15, 2020Population growth in areas most vulnerable to hurricanes is of concern to emergency managers but so are the 2.4 million businesses in coastline areas.
-
America Counts StoryThe 2018 Annual Survey of Manufactures Is OutJune 23, 2020The first Annual Survey of Manufactures in more than two years is now available. An infographic outlines total value of shipments and payroll in the sector.
-
PopulationU.S. Fertility Continues to Drop but Still High in Some CountiesJune 25, 2026Counties with the highest numbers of births have some of the lowest fertility rates.
-
TaxationFundamental Shifts in State Taxes in Past CenturyJune 17, 2026Income and sales taxes have largely replaced property taxes, once the lion’s share of state tax revenue.
-
HousingHelping You Decide Where to Buy a HomeJune 10, 2026Census Bureau resources help homebuyers find the best locations for their needs.
-
Population2026 World Cup Teams Will Have Home Crowds Among U.S. Foreign-BornJune 09, 2026Census data show which of the 48 countries in the World Cup have the largest foreign-born fan bases in the United States and where they live.