Poverty Rate for the Black Population Fell Below Pre-Pandemic Levels
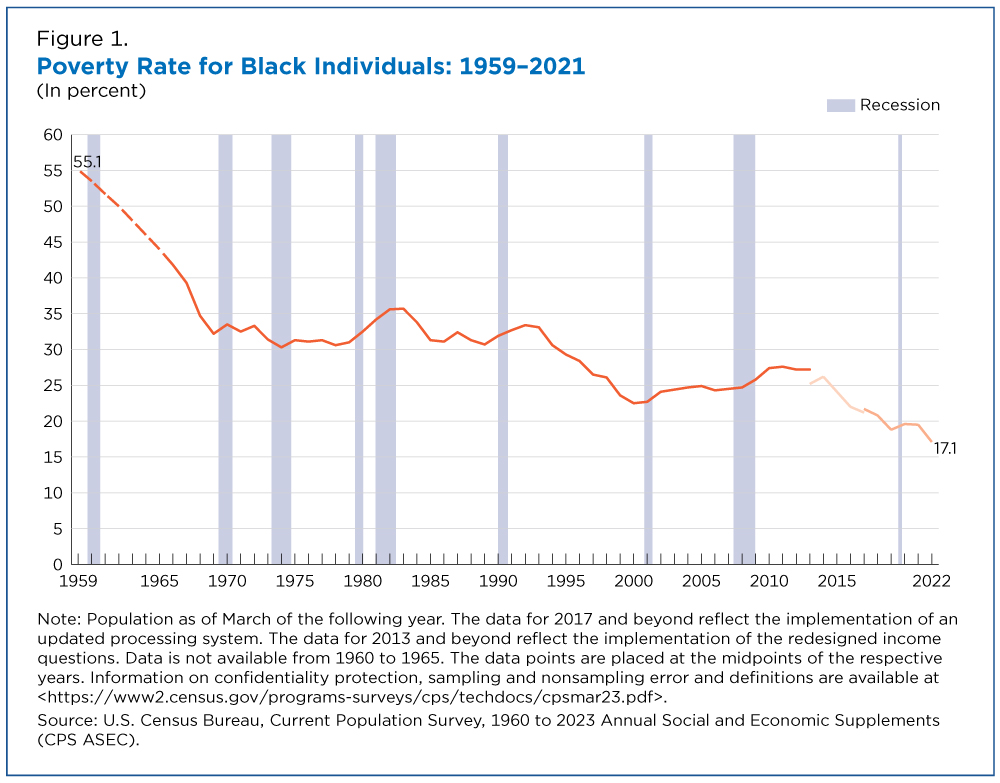
The official poverty rate of the U.S. Black population reached a historic low of 17.1% in 2022, according to U.S. Census Bureau data released today.
The 2022 poverty rate for the Black population fell to a record low even after accounting for survey and methodological changes to the CPS ASEC, the Census Bureau’s longest-running survey.
Estimates from the Current Population Survey Annual Social and Economic Supplement (CPS ASEC) show the Black population was one of the only major demographic groups to experience a significant change in poverty between 2021 and 2022.
The official poverty rate for the nation was 11.5%, unchanged from 2021.
The 2022 poverty rate for the Black population fell to a record low even after accounting for survey and methodological changes to the CPS ASEC, the Census Bureau’s longest-running survey.
Figure 1 charts historic official poverty rates for the Black population back to 1959, when the official poverty rate for Black individuals was 55.1%, the highest rate on record.
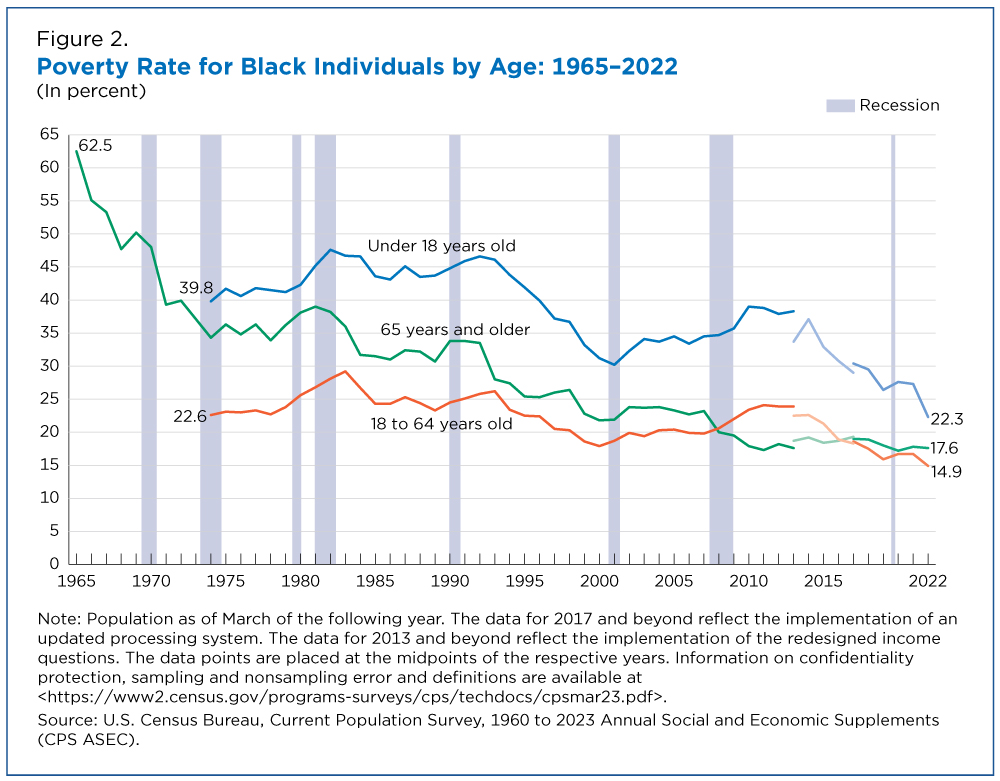
Poverty rates in 2022 were also at historic lows for Black children under 18, at 22.3% (Figure 2).
The 2022 official poverty rate for Black adults ages 18 to 64 was 14.9%, numerically a historic low (though not statistically different from 2019). The official poverty rate for Black adults 65 and older was 17.6%, not statistically different from 2021.
Racial Inequalities Persist
Despite the overall decline in the poverty rate for Black individuals, racial inequalities persist.
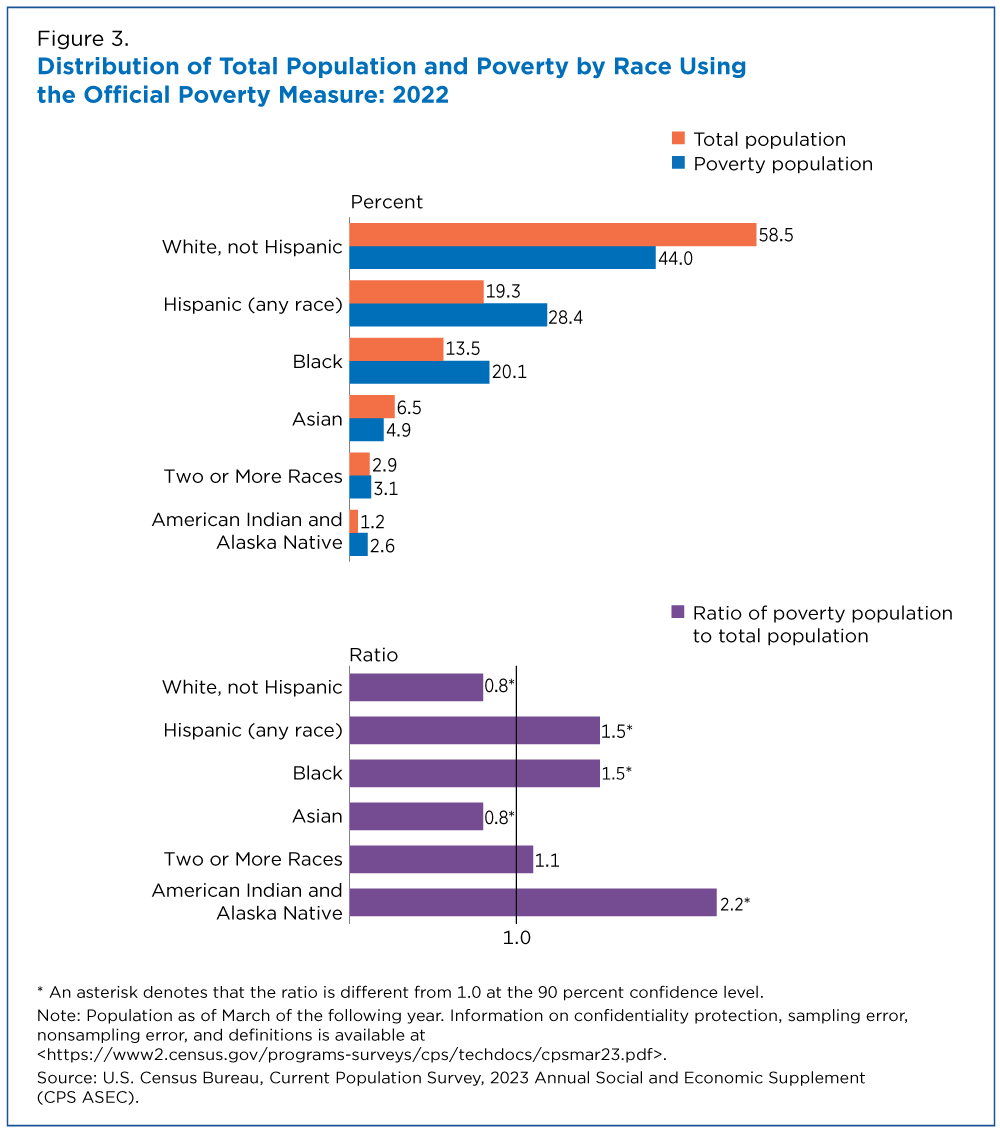
Figure 3 looks at six race and Hispanic origin groups. Comparing the share of a particular group in poverty to that group’s share of the total population shows whether they are underrepresented or overrepresented in poverty.
Groups with ratios of less than 1.0 are underrepresented (their share in poverty is lower than their share of the population), while groups with ratios greater than 1.0 are overrepresented (their share in poverty is higher than their share of the population).
For example, Black individuals made up 20.1% of the population in poverty in 2022 but only 13.5% of the total population. This results in a ratio of 1.5, meaning that the Black population was overrepresented in poverty.
The Hispanic population was also overrepresented in poverty (ratio of 1.5). Ratios for the Black and Hispanic populations were not statistically different from one another.
The American Indian and Alaska Native population (ratio of 2.2) was the most overrepresented in poverty.
Non-Hispanic White and Asian individuals were underrepresented in poverty, both with a ratio of 0.8, not statistically different from one another.
The ratio for the Two or More Races population was not statistically different from 1.0, meaning that this group was neither over- nor underrepresented in poverty.
How the Census Bureau Measures Poverty
Each year the Census Bureau releases two measures of poverty: the official poverty measure and the Supplemental Poverty Measure (SPM). The official poverty measure, available back to 1959, defines poverty by comparing pretax money income to a national poverty threshold adjusted by family size, number of children and age of householder.
The SPM, available back to 2009, extends the official poverty measure by accounting for federal and state taxes, work and medical expenses, geographic variation in housing and several government programs designed to assist low-income families.
While the official poverty measure showed poverty rates declining between 2021 and 2022 for Black individuals, the SPM showed an increase from 11.3% in 2021 to 17.2% in 2022. This large increase in SPM poverty was due to the expiration of pandemic safety net programs like stimulus payments and expanded refundable tax credits. These policies contributed to record low SPM rates in 2021 [PDF 2.7 MB] for both the total and Black populations.
More details on both measures can be found in the report released today: Poverty in the United States: 2022.
About CPS ASEC
CPS ASEC data are released annually in September and are the source for the official poverty measure and the Supplemental Poverty Measure.
Several historical and detailed official poverty tables derived from the CPS ASEC are also available. More information on confidentiality protection, methodology, sampling and nonsampling error, and definitions is available in the CPS ASEC technical documentation.
Data Tables
Related Statistics
-
Facts for Features & Special EditionsNational Black (African American) History Month: February 2023To commemorate and celebrate the contributions to our nation made by people of African descent, historian Carter G. Woodson established Black History Week.
-
Stats for StoriesJuneteenth (1865): June 19, 2024Juneteenth celebrates the end of slavery in the U.S. as issued by President Lincoln’s Emancipation Proclamation. In 2021, it became our newest national holiday.
-
Current Population Survey (CPS)The CPS is a monthly survey sponsored by the Bureau of Labor Statistics and conducted by the U.S. Census Bureau.
-
America Counts: Stories About Income & PovertyExplore various America Counts stories on the topic of income and poverty.
-
America Counts: Stories About Race
-
Income and PovertyIncome is the gauge many use to determine the well-being of the U.S. population. Survey and census questions cover poverty, income, and wealth.
-
RaceThe data on race and ethnicity were derived from answers to the question on race and ethnicity that was asked of individuals in the United States.
Subscribe
Our email newsletter is sent out on the day we publish a story. Get an alert directly in your inbox to read, share and blog about our newest stories.
Contact our Public Information Office for media inquiries or interviews.
-
Income and PovertyMedian Household Income After Taxes Fell 8.8% in 2022September 12, 2023The expiration of expansions to federal programs during COVID-19 resulted in lower post-tax household income and higher poverty rates.
-
Income and Poverty2022 Income Inequality Decreased for First Time Since 2007September 12, 2023U.S. Census Bureau income data released today show declines in real income at the middle and top of the income distribution from 2021 to 2022.
-
HealthHealth Insurance Coverage of U.S. Workers Increased in 2022September 12, 2023Health insurance coverage for working-age adults ages 19 to 64 improved in 2022 across race groups and Hispanic origin and in most regions.
-
Income and PovertySupplemental Poverty Measure in 2022 Higher Than Pre-Pandemic LevelSeptember 12, 2023The Supplemental Poverty Measure (SPM) that accounts for government assistance increased from 7.8% in 2021 to 12.4% in 2022.
-
PopulationU.S. Population Growth Slowest Since COVID-19 PandemicJanuary 27, 2026The decline in international migration was felt across the states, though its impact varied.
-
Business and EconomyWho Are the Inventors and Firms That Generate the Most Patents?January 22, 2026Research that links patent inventors to Census Bureau data shows that startups tended to produce fewer but more impactful patents than older firms.
-
Marriage and DivorceThe Long-Term Effects of Divorce on ChildrenJanuary 20, 2026Children of divorce face higher risks of teen pregnancy, incarceration, low income and early death.
-
Business and EconomyExploring New Frontiers With the Quarterly Workforce IndicatorsJanuary 13, 2026New data on employment and hiring for detailed national industries enable data users to explore the composition and dynamics of specialized workforces.


