2015 Capital Spending Report Visualizations
2015 Capital Spending Report Visualizations
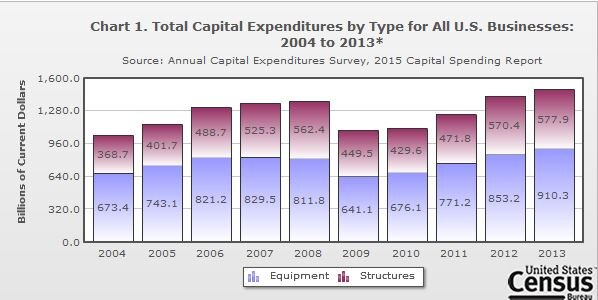
Charts
- Page 1 of 2

Related Information
Page Last Revised - October 8, 2021
Related Information