District of Columbia Had Lowest Percentage of Married Black Adults in 2015-2019
U.S. marriage rates have been on the decline since the latter half of the 20th century and both men and women are marrying at a later age, but the decline and delay are even more dramatic among Black adults.
The median age at first marriage has risen for both men and women. In 1970, the median age at first marriage was 23.2 years for men, and 20.8 years for women. Fifty years later, those figures climbed to 30.5 years and 28.1 years, respectively.
Although there have been drastic changes in marriage patterns for all race and Hispanic origin groups, differences have been especially pronounced for non-Hispanic Black adults (throughout this story, Black is used interchangeably with non-Hispanic Black).
For all groups, the percentage of never married men in 1970 was 28.1%, compared to 22.1% of women. By 2020, these figures rose to 35.8% and 30.0%, respectively. However, in 1970, 35.6% of Black men and 27.7% of Black women were never married, but by 2020, these percentages had jumped to 51.4% for Black men and 47.5% for Black women.
While the percentage of all adults who were never married increased by 7.6 percentage points for men and 7.9 percentage points for women, the corresponding change for Black adults was more than double that, at 15.8 percentage points for men and 19.8 for women.
Similarly, the median age at first marriage for Black adults increased more dramatically than it did for the overall population.
Although there have been drastic changes in marriage patterns for all race and Hispanic origin groups, differences have been especially pronounced for non-Hispanic Black adults.
Over the past several decades, the Black population also experienced a considerable amount of geographic mobility. And yet, like many race/ethnicity sub-populations in the United States, the non-Hispanic Black population is not equally dispersed across the country.
From 1910 until 1970, about 6 million Black people migrated from the South to the Northeast, Midwest, and West, a period known as the Great Migration. Despite the geographic mobility of Black people, the South still contains the greatest share of the Black population, including those who have returned.
A recent Census Bureau working paper that focuses on metropolitan areas in the South finds socioeconomic factors such as poverty and educational attainment are associated with geographic variations in marriage prevalence.
Which States Had Higher Percentages of Married Black Adults?
Estimates from the American Community Survey 5-year Public Use Microdata Samples for 2005-2009 and 2015-2019 give us a geographic portrait of marriage among Black adults in the United States comparing time periods in two decades.
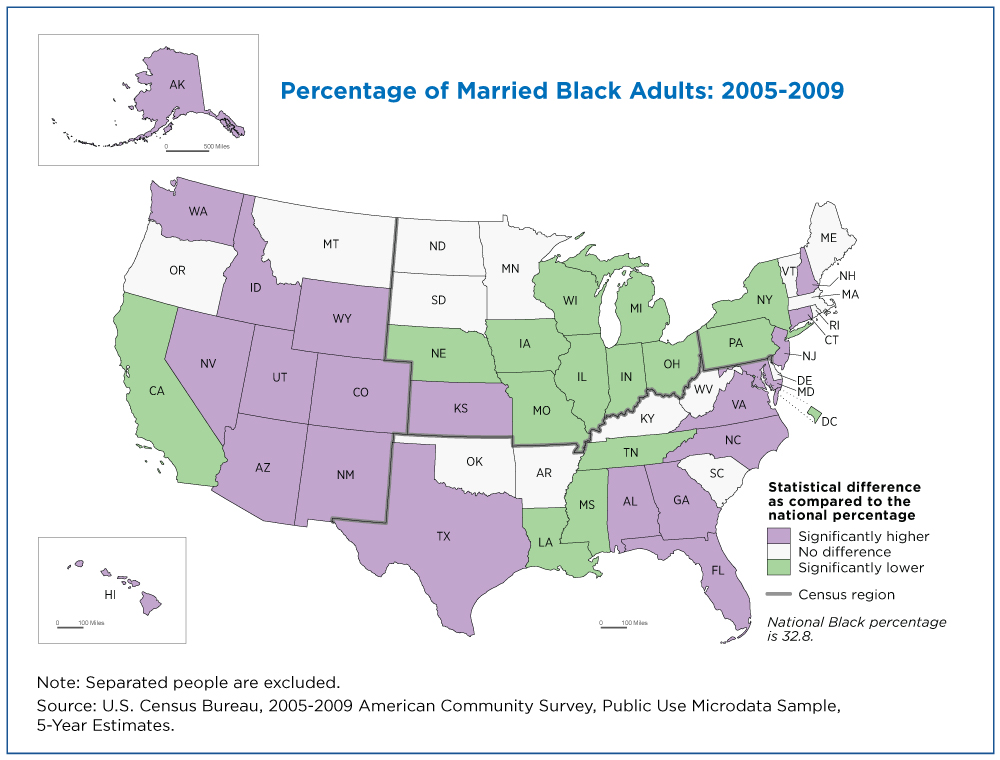
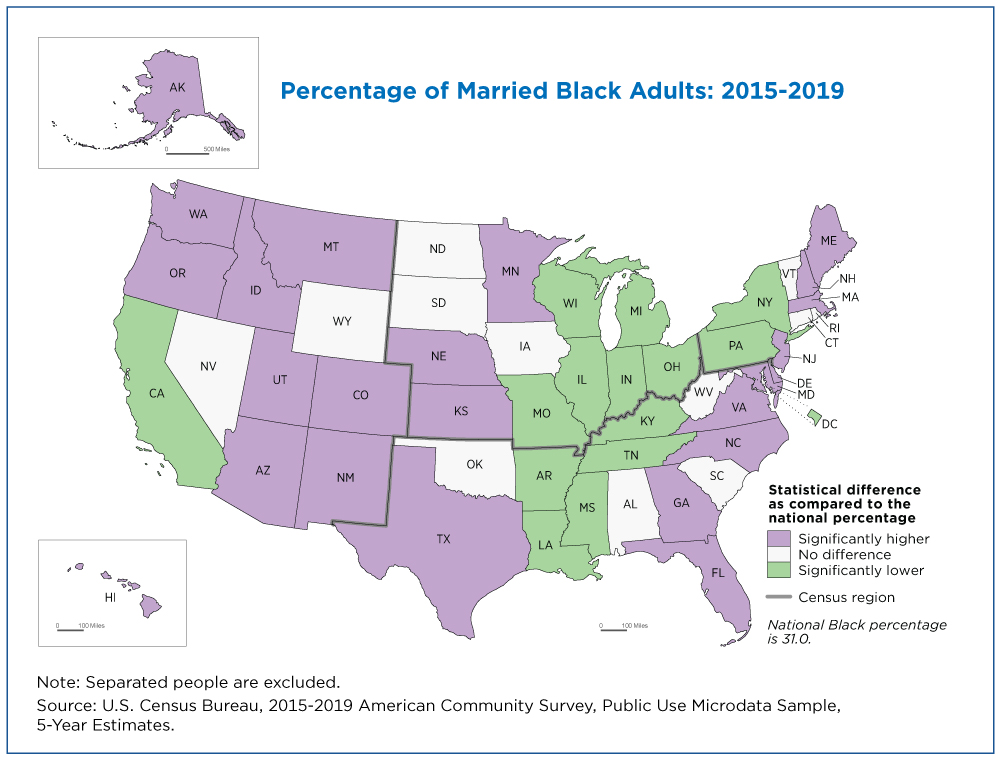
The first and second maps show which states have a significantly higher or lower percentage of married Black adults, compared to the national average of married Black adults. In this analysis, spouses may be of any race and separated people are excluded.
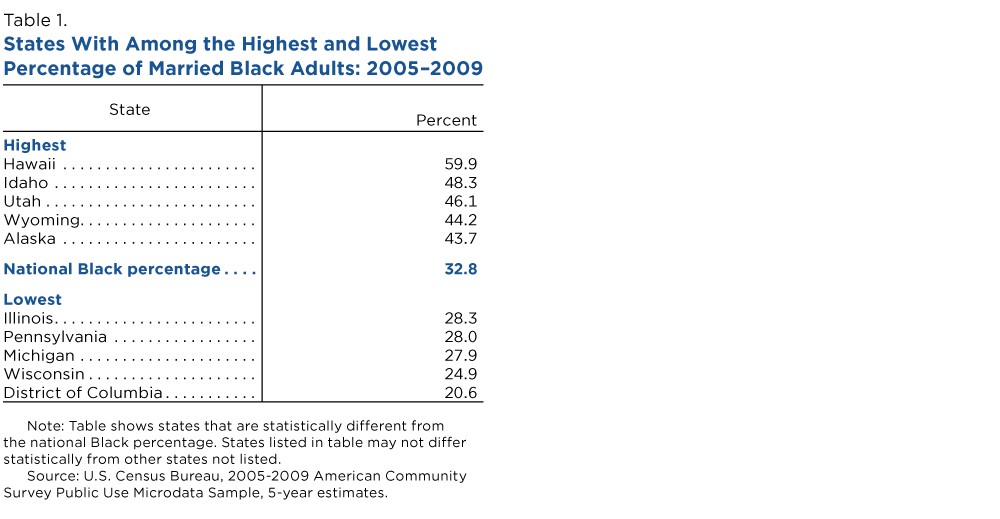
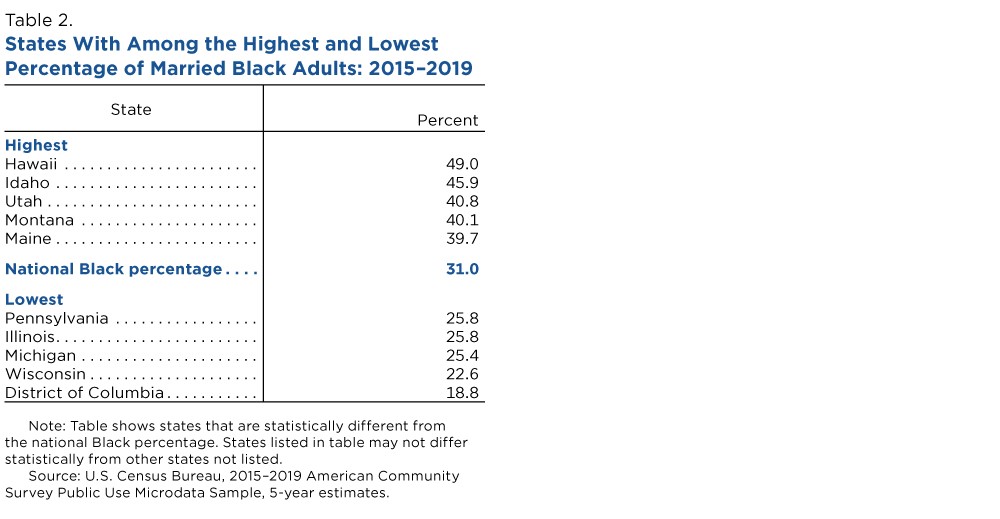
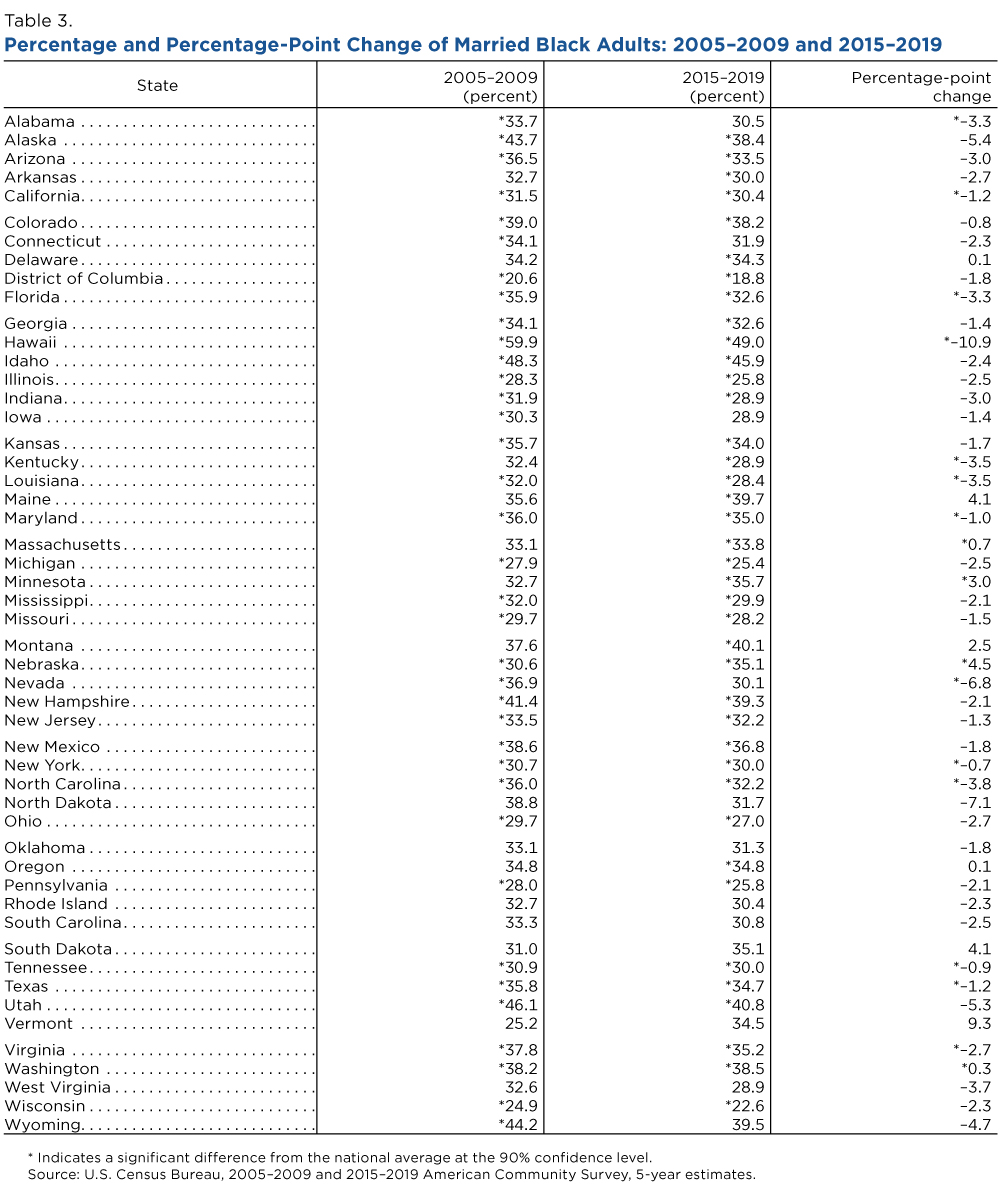
Compared to the national average of 32.8% in 2005-2009 and 31.0% in 2015-2019, states with a significantly higher percentage of married non-Hispanic Black adults were primarily concentrated in the West and South for both periods.
In contrast, of the states with a significantly lower percentage of married Black adults, more than half of them were in the Midwest in 2005-2009 (Illinois, Indiana, Iowa, Michigan, Missouri, Nebraska, Ohio, and Wisconsin).
Similarly, in 2015-2019, the Midwestern states still had among the lowest shares of married Black adults. During this period, six of the states with a significantly lower percentage of married Black adults were in the Midwest (i.e., Illinois, Indiana, Michigan, Missouri, Ohio, and Wisconsin) (Figure 2).
State Highlights
- In 2005-2009 and 2015-2019, Hawaii had the largest percentage of married Black adults (in 2015-2019, Hawaii was not significantly different from Idaho and Wyoming).
- California was the only Western state with a significantly lower percentage of married Black adults in 2005-2009 and 2015-2019, compared to the national average.
- In 2005-2009 and 2015-2019, the District of Columbia had the lowest percentage of married Black adults. However, the District of Columbia was not significantly different from Vermont in the 2005-2009 period.
States at the National Average
In some states, the percentage of married Black adults differed from the national average for only one of the two 5-year periods.
In seven states, the percentage of married Black adults did not significantly differ from the national average for both 2005-2009 and 2015-2019: North Dakota, Oklahoma, Rhode Island, South Carolina, South Dakota, Vermont, and West Virginia.
Change Over Time
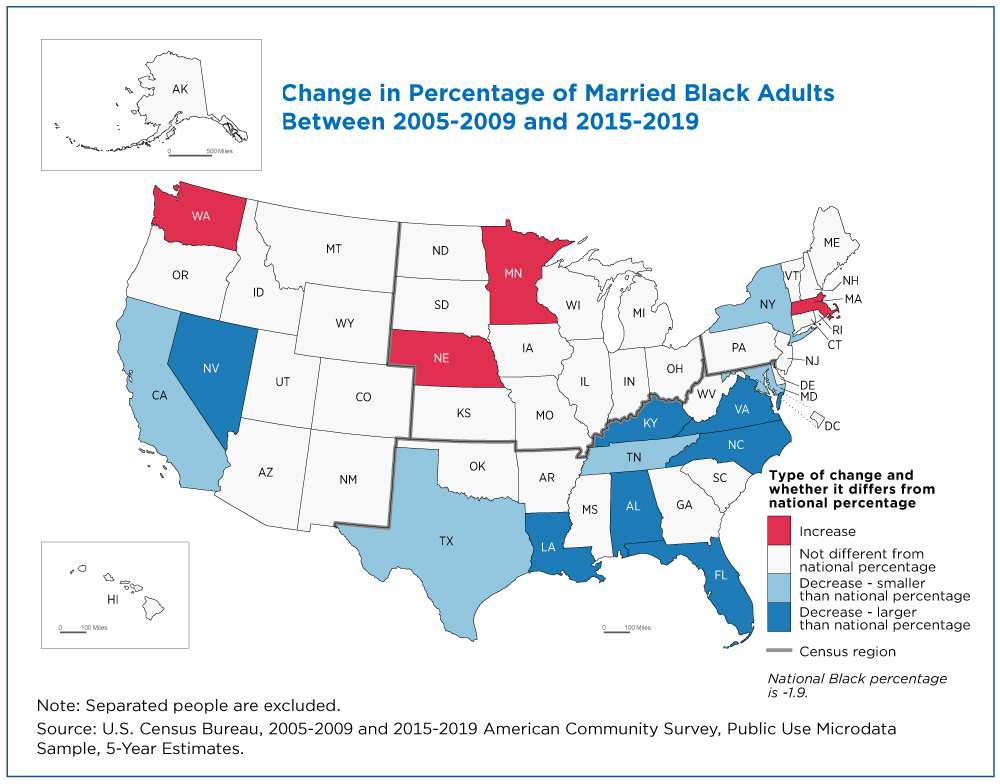
The third map shows whether the change in each state differs from the decline experienced for the nation overall.
- While the United States as a whole saw a 1.9 percentage-point decrease in married Black adults, four states — Massachusetts, Minnesota, Nebraska, and Washington — experienced a significant increase.
- Notably, there were no Southern states that had significant increases in the percentage of married Black adults.
- Eight states — Alabama, Florida, Hawaii, Kentucky, Louisiana, Nevada, North Carolina, and Virginia — experienced a significant decline in the percentage of married Black adults that was larger than the national decline of 1.9 percentage points.
- Five states — California, Maryland, New York, Tennessee, and Texas — experienced a significant decline in the percentage of married Black adults that was smaller than the decline for the nation.
The ACS microdata used for this analysis can be accessed here. For a comprehensive look at marriage and divorce patterns, refer to the Number, Timing and Duration of Marriages and Divorces: 2016 report.
Chanell Washington and Laquitta Walker are family demographers in the Census Bureau’s Fertility and Family Statistics Branch.
Related Statistics
-
Stats for StoriesNational Spouses Day: January 26, 2024According to the Current Population Survey 2023 ASEC Supplement, there are some 133.1M married adults age 15+ in the U.S., not counting 4.6M who are separated.
-
Stats for StoriesUnmarried and Single Americans Week: September 17-23, 2023In 2022, about 132.3 million or 49.3% of Americans age 15 and over were unmarried, according to the Current Population Survey.
-
American Community Survey (ACS)The American Community Survey is the premier source for information about America's changing population, housing and workforce.
Subscribe
Our email newsletter is sent out on the day we publish a story. Get an alert directly in your inbox to read, share and blog about our newest stories.
Contact our Public Information Office for media inquiries or interviews.
-
America Counts StoryMarital Histories Differ Between Native-Born and Foreign-Born AdultsMay 03, 2021New Census Bureau report reveals foreign-born people are more likely than native-born to marry, are older when they first marry and are less likely to remarry.
-
America Counts StoryHow State Marriage and Divorce Rates Stack UpFebruary 20, 2020New interactive data visual allows users to compare marriage and divorce rates across states for 2008 and 2018.
-
America Counts StoryRace, Ethnicity and Marriage in the United StatesJuly 09, 2018Every state has seen an increase in the percentage of married-couple households that are interracial or interethnic, but changes varied across the U.S.
-
IncomeHow Income Varies by Race and GeographyJanuary 29, 2026Median income of non-Hispanic White households declined in five states over the past 15 years: Alaska, Connecticut, Louisiana, Nevada, and New Mexico.
-
HousingRental Costs Up, Mortgages Stayed FlatJanuary 29, 2026Newly Released American Community Survey compares 2020-2024 and 2015-2019 housing costs by county.
-
HousingShare of Owner-Occupied, Mortgage-Free Homes Up in 2024January 29, 2026The share of U.S. homeowners without a mortgage was higher in 2024 than a decade earlier nationwide and in every state, though not all counties saw increases.
-
PopulationU.S. Population Growth Slowest Since COVID-19 PandemicJanuary 27, 2026The decline in international migration was felt across the states, though its impact varied.

