Recognizing Manufacturing’s Contributions to the U.S. Economy During Manufacturing Week
Large states like California, Texas and Florida almost always rank at the top of business lists because of the sheer size of their populations.
But their business output in relation to their population size is often dwarfed by smaller states.
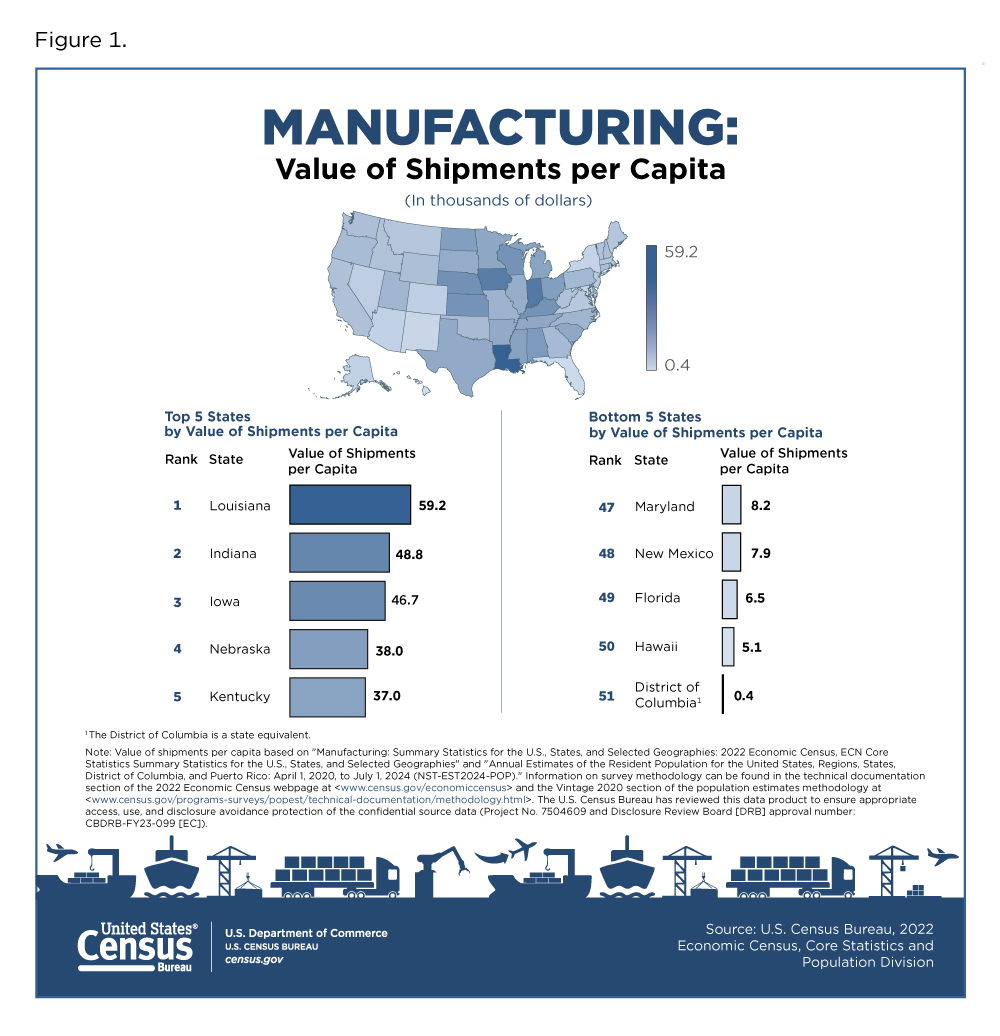
A new Census Bureau data visualization offers a novel spin on states’ value of manufacturing shipments by analyzing data per capita (the value of shipments divided by the number of people in a state).
In 2022, for example, Louisiana ranked 25th by population but number one in value of manufacturing shipments (revenue) per capita while Florida — the nation’s third most populous state — was in the bottom five.
The U.S. Census Bureau this week is highlighting these and other key manufacturing data in recognition of the 14th annual Manufacturing Day, October 3.
Manufacturing Week pays tribute to a key driver of the U.S. economy, showcasing the benefits and potential of modern manufacturing, and promoting careers in the industry.
Per Capita Value of Shipments
A new Census Bureau data visualization offers a novel spin on states’ value of manufacturing shipments by analyzing data per capita (the value of shipments divided by the number of people in a state).
Using the 2022 Economic Census and 2022 Population Estimates, Figure 1 highlights the top five states by value of manufacturing shipments per capita, none of which were among the most populous.
What drives manufacturing activity in the top states?
- Louisiana ranked first at $59,217 per capita in revenue, fueled by its Petroleum and Coal Products Manufacturing.
- California, the most populous state, ranked 32nd ($16,763) per capita, predominantly due to its Food Manufacturing and Chemical Manufacturing subsectors.
- Indiana, the 17th largest by population, ranked second ($48,757), and Kentucky, 26th in population, ranked fifth ($36,999) in revenue, both driven by their Transportation Equipment Manufacturing.
- Iowa, 31st in population, was third in manufacturing revenue ($46,745) and Nebraska, 37th most populous, was fourth ($38,001) due to their Food Manufacturing.
- Texas, ranked 2nd in population, was 17th per capita in manufacturing revenue ($26,832) due to the state’s large Petroleum and Coal Products Manufacturing subsector.
Economic Census Data Visualizations
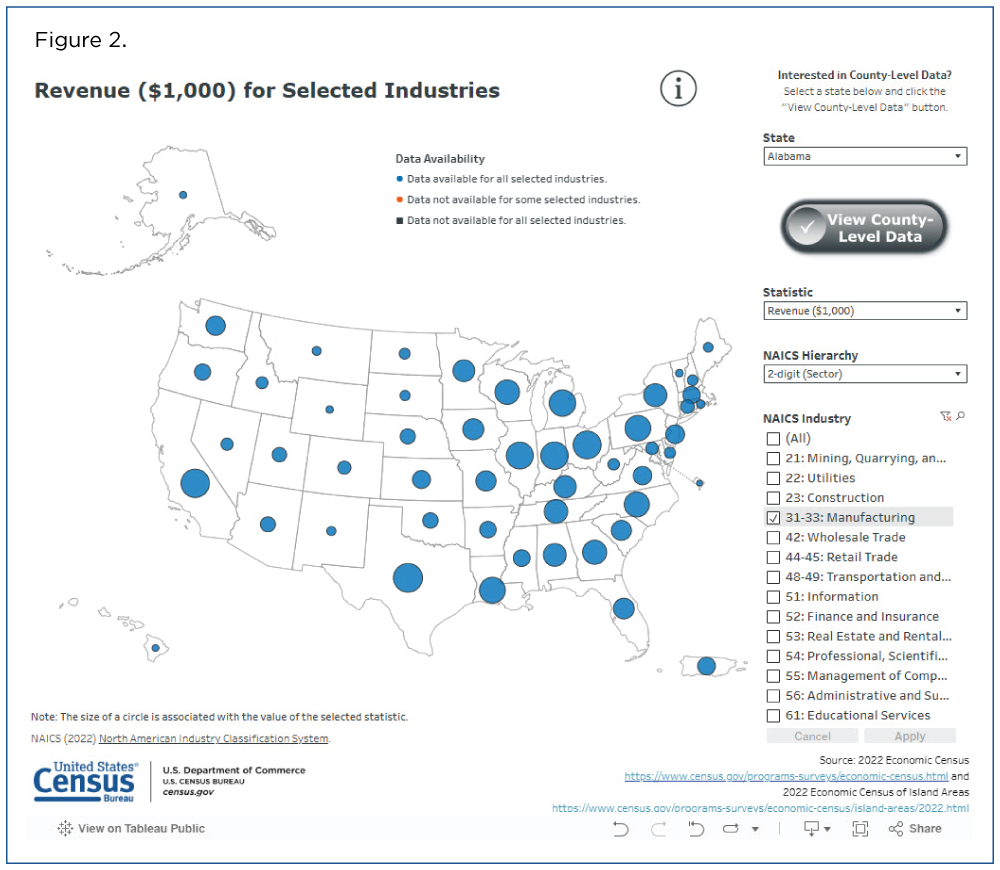
The data visualization below shows where total manufacturing activity primarily takes place. As expected, the most populous states had the highest total revenues (Figure 2).
Texas ranked number one with a total value of shipments of $808.0 billion, followed by California ($656.1 billion), Ohio ($374.0 billion), Indiana ($333.7 billion) and Illinois ($319.6 billion).
Note: Select the image to go to the interactive data visualization.
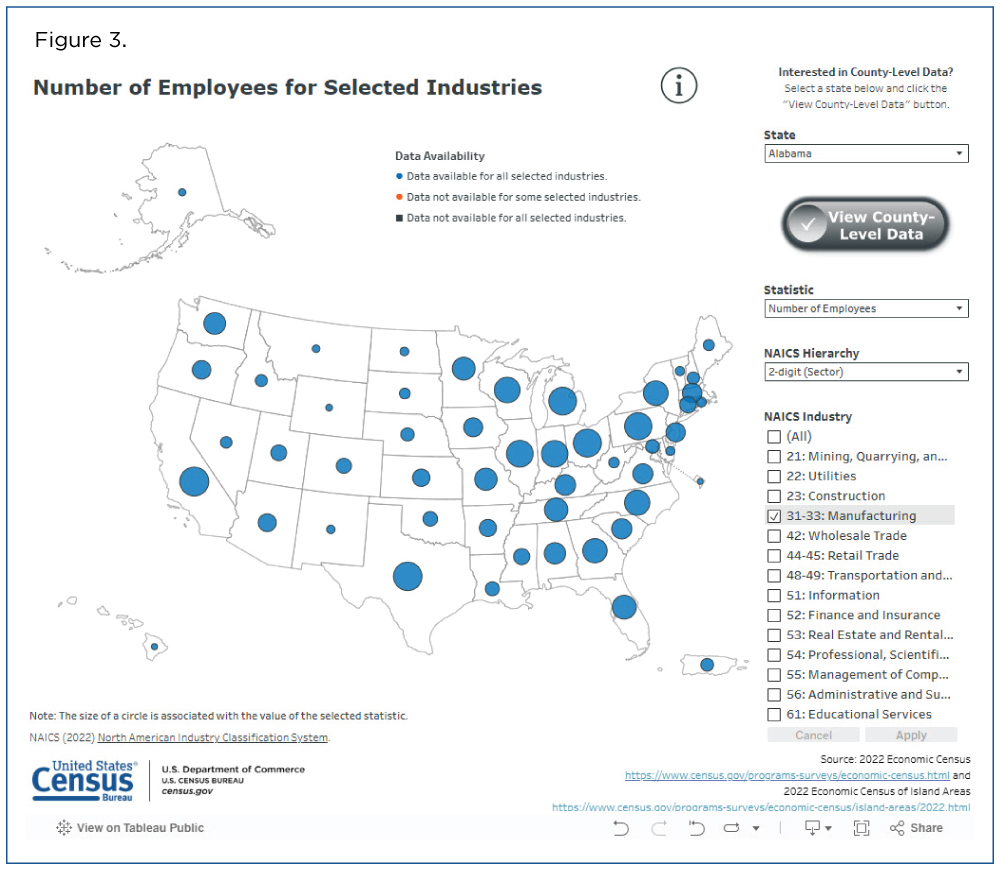
The visualization also tracks manufacturing employment by state (Figure 3). Once again, states among the 10 most populous topped the list: California ranked number one with 1,181,588 total manufacturing sector employees, followed by Texas (853,346), Ohio (678,989), Michigan (590,386) and Pennsylvania (563,035).
Note: Select the image to go to the interactive data visualization.
Manufacturing Week Webpage
The Census Bureau’s Manufacturing webpage provides manufacturing statistics and data products featuring a wide range of resources, including other America Counts stories, data, data tools, visualizations, training resources and news.
It also highlights careers in manufacturing, part of the sector’s effort to encourage thousands of companies and educational institutions around the nation to open their doors to students, parents, teachers and community leaders.
Related Statistics
Subscribe
Our email newsletter is sent out on the day we publish a story. Get an alert directly in your inbox to read, share and blog about our newest stories.
Contact our Public Information Office for media inquiries or interviews.
-
Business and EconomyEconomic Census Geographic Area Statistics Data Now AvailableApril 07, 2025A new data visualization based on the 2022 Economic Census shows the changing business landscape of 19 economic sectors across the United States.
-
Business and EconomyManufacturing Faces Potential Labor Shortage Due to Skills GapSeptember 29, 2023The Census Bureau celebrates Manufacturing Week with new data visualizations, stories and data products from the manufacturing sector.
-
Business and EconomyEconomic Census Highlights Unique Characteristics of U.S. Island AreasSeptember 25, 2024Tourism-related industries dominate some island economies while manufacturing and construction are the leading industries on other islands.
-
IncomeHow Income Varies by Race and GeographyJanuary 29, 2026Median income of non-Hispanic White households declined in five states over the past 15 years: Alaska, Connecticut, Louisiana, Nevada, and New Mexico.
-
HousingRental Costs Up, Mortgages Stayed FlatJanuary 29, 2026Newly Released American Community Survey compares 2020-2024 and 2015-2019 housing costs by county.
-
HousingShare of Owner-Occupied, Mortgage-Free Homes Up in 2024January 29, 2026The share of U.S. homeowners without a mortgage was higher in 2024 than a decade earlier nationwide and in every state, though not all counties saw increases.
-
PopulationU.S. Population Growth Slowest Since COVID-19 PandemicJanuary 27, 2026The decline in international migration was felt across the states, though its impact varied.


