
Demographic Analysis Uses Birth and Death Records, International Migration Data and Medicare Records to Produce a Range of Population Estimates as of April 1, 2020
The tabulation of the official 2020 Census count of the U.S. population is not yet complete, but in the meantime, the U.S. Census Bureau released today an estimate of the population as of April 1, 2020 of 332.6 million.
This number was part of a range of estimates, which is explained in more detail below.
These population numbers do not come from the 2020 Census but are the results of Demographic Analysis (DA).
They are produced using birth and death records, data on international migration and Medicare records. DA does not include any data from the 2020 Census, which relies on collecting responses from households.
In addition to providing estimates of the total population for the nation, Demographic Analysis also provides national-level estimates of the U.S. population by age, sex, and broad race and Hispanic origin groups.
DA estimates are different than the annual official population estimates, which are typically created by using the most recent census as a base and measuring annual population change relative to that base. They are not based on the previous census.
Instead, we start with birth records from 1945 to 2020 and account for deaths, immigration and emigration to each birth cohort. We use Medicare records to develop estimates for those cohorts born before 1945 (ages 75 and older in 2020).
Cohorts are population groups born in the same year that experience similar events in history at the same age.
DA is one of two programs that the Census Bureau uses to assess the accuracy of the decennial census by estimating coverage error. Coverage error occurs when certain population groups are overcounted or undercounted in the census.
The other census check is the Post-Enumeration Survey, which will be released next year. Table 1 shows 2020 DA estimates for the total population and by five-year age group, ranging from a low of 330.7 million to a middle estimate of 332.6 million to a high of 335.5 million.
Current and historical birth records are the foundation of DA estimates. The total estimate for each cohort is calculated by answering two questions:
- Who was in the birth records from 1945 to 2020 but did not live in the United States on April 1, 2020? Answer: People who died or were living abroad.
- Who was living in the United States on April 1, 2020, but was not in the birth records? Answer: the foreign-born population, people who migrated to the states from Puerto Rico and those born abroad of U.S. citizen parents now living in the United States.
The Census Bureau uses a demographic accounting process to produce the DA estimate of the total U.S. population. Here’s how it works:
- We begin with birth records to get our initial estimate of that cohort. Next, we subtract all deaths to that cohort that occurred between the birth year and the census year..
- We then account for international migration. This includes the international migration of the native population, the population that has migrated from Puerto Rico, people born abroad of U.S. citizen parents who are now living in the United States, and the foreign-born population.
- We also account for the U.S. Armed Forces population living overseas at the time of the census and current and historical Armed Forces deaths that occurred overseas.
- Finally, we use Medicare records to estimate the population born before 1945 (ages 75 and older in 2020).

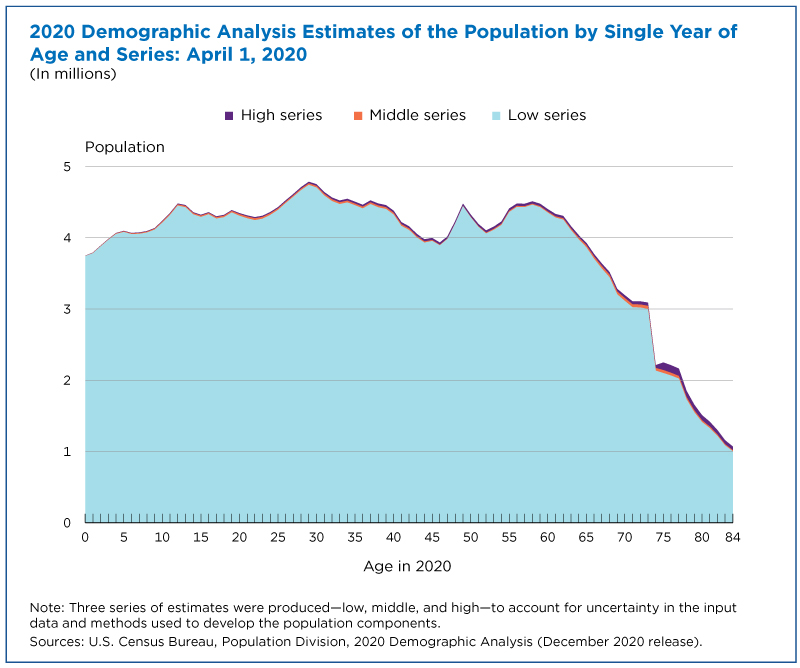
High, Middle, and Low Estimates
The Census Bureau produced a range of estimates — high, middle and low — to account for uncertainty in the input data and methods used to produce the final DA estimates.
We developed the range by varying the methods and assumptions used to produce the population components. Each of the series is a reasonable demographic estimate for the population.
Because the vital records system in the United States is very complete, there is little variability in the births and deaths components.
Estimates of the foreign-born population account for the largest share of uncertainty in the overall DA estimates. Unlike births and deaths, people can migrate more than once during their lifetime, and data on this population are often limited or lacking.
When results from the 2020 Census are finalized, the DA estimates will be used to evaluate how close the census came to meeting its goal of counting everyone living in the United States.
Additional Data on Select Demographic Groups
In addition to providing estimates of the total population for the nation, Demographic Analysis also provides national-level estimates of the U.S. population by age, sex, and broad race and Hispanic origin groups.
Specifically, estimates are available for the number of people who are:
- Black alone/non-Black alone by sex for ages 0 to 85 and above,
- Black alone or in combination/non-Black alone or in combination by sex for ages 0 to 85 and above, and
- Hispanic/non-Hispanic by sex for ages 0 to 29.
These data allow us to see patterns in coverage by age, sex, the DA race categories, and Hispanic origin for cohorts born after 1990 throughout the decades. For instance, we can compare DA results with census data to identify groups that may have been overcounted or undercounted in the census.
Some highlights from today’s release in order of low, middle and high estimates:
- The percentage of the U.S. population estimated to be Black alone was 13.5, 13.7 and 13.9, respectively.
- The percentage of the population estimated to be Black alone or in combination with other races was 14.9, 15.1 and 15.4, respectively.
- For the population under age 30, the percentage estimated to be Hispanic was 23.0, 24.6 and 26.0, respectively. DA estimates are only available for Hispanic/non-Hispanic by sex for ages 0-29.)
While DA estimates are only available for a limited number of race groups because they rely on historical records and measures of race that have changed over time, they serve as a valuable resource to inform us about the age and sex structure of the nation’s population as a whole.
In 2022, we plan to produce experimental estimates for the population ages 0 to 17 for White, Black or African American, American Indian and Alaska Native, Asian, Native Hawaiian and Other Pacific Islander, and Two or More Races, and by Hispanic origin. These estimates will incorporate race detail available in both birth and death records since 2003.
This interactive data visualization shows age, sex and race data from DA for April 1 in 2000, 2010 and 2020.

Eric Jensen is the senior technical expert for Demographic Analysis at the Census Bureau.
-
Stats for Stories*Special Edition* World Statistics Day 2020: Oct. 20, 2020Every five years on Oct. 20 we celebrate how innovation drives the U.S. Census Bureau to create new and improved data products to better serve our customers.
-
Stats for StoriesWorld Population Day: July 11, 2026The U.S. Census Bureau’s International Database projects the world population will reach 8.2 billion this year and 9 billion in 2039.
Subscribe
Our email newsletter is sent out on the day we publish a story. Get an alert directly in your inbox to read, share and blog about our newest stories.
Contact our Public Information Office for media inquiries or interviews.
-
America Counts StoryDemographic Analysis Shows Population Estimates as of April 1, 2020December 09, 2020Independent estimates will help assess the accuracy of the 2020 Census. Demographic Analysis uses vital and Medicare records and international migration data.
-
America Counts StoryNation’s Population Growth Slowed This DecadeApril 06, 2020See how your state’s population changed over the decade in an interactive visualization recently released by the U.S. Census Bureau.
-
America Counts StoryHow We Develop and Improve the CensusJuly 31, 2019Randomized experiments and carefully planned evaluations help improve the census.
-
PopulationMeasuring Foreign-Born Population Over Nation’s 250-Year HistoryJuly 21, 2026Historical census data document changes in the foreign-born population in both numbers and countries of origin.
-
Business and EconomyA Road Trip Across the Vacation EconomyJuly 14, 2026The Census Bureau rings in the summer with a travel statistics road map.
-
HealthWhere You Live Matters for Your Health and So Does How We Measure ItJuly 09, 2026Census Bureau research helps policymakers and researchers identify the most reliable ways to predict health outcomes and distribute resources accordingly.
-
PopulationU.S. Fertility Continues to Drop but Still High in Some CountiesJune 25, 2026Counties with the highest numbers of births have some of the lowest fertility rates.